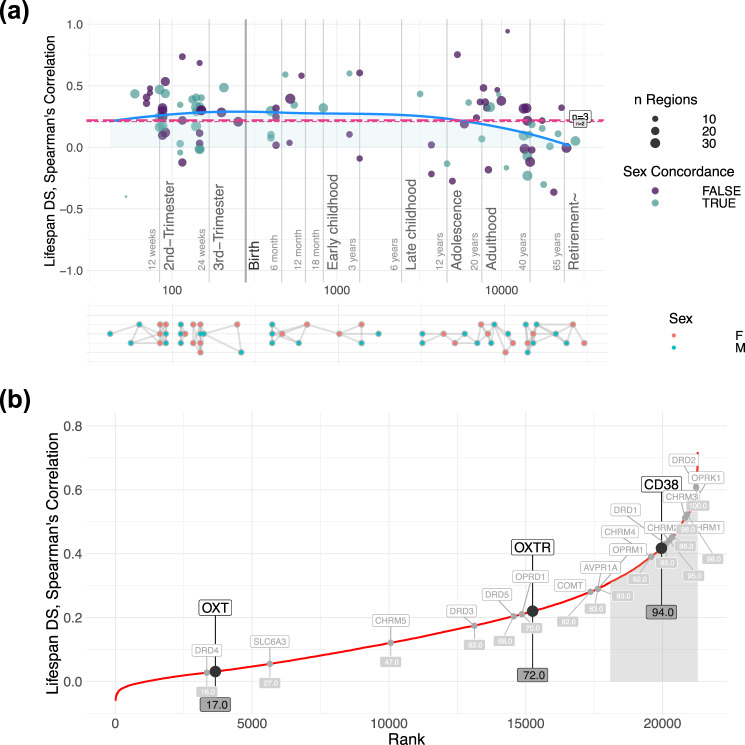
Fig. 4. Differential stability for OXTR, CD38, and OXT across development.
a The differential stability of OXTR is relatively constant across the lifespan, with a modest dip during adulthood. The blue line represents lifespan trajectory and the dashed horizontal red lines illustrate the mean of all points (long dashes = 3 pair comparisons; short dashes = 4 pair comparisons). Purple dots show the correlation between two donors of the same sex, whereas turquoise dots show the correlations of opposite sexes. The size of the dots corresponds to the number of brain regions. The bottom section illustrates a map of donor comparisons, where pairs used for differential stability estimation are connected with edges. b The differential stability of OXTR, CD38, and OXT were compared against 21,323 genes, across development. The top 15% of differential stability values are shaded in light gray. Both CD38 and OXTR can be considered to be highly conserved as their scores are in the top 50% [37].

