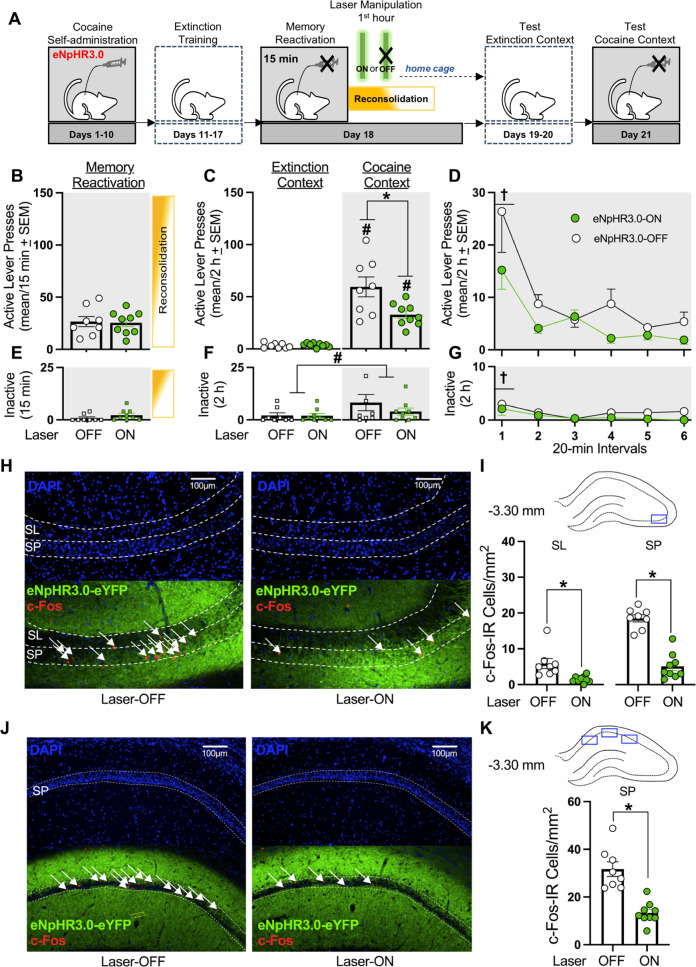
Fig. 1. Optogenetic inhibition of the dCA3 during the first h of cocaine-memory reconsolidation reduces cocaine-memory strength and dCA3 neuronal activation at test.
A Timeline for experiment 1. Following cocaine self-administration and extinction training, eNpHR3.0-expressing rats received a 15-min memory-reactivation session, immediately followed by Laser-ON (n = 9) or Laser-OFF (n = 8) treatment for 1 h. Lastly, rats received test sessions in the extinction and cocaine-paired contexts to assess extinction- and cocaine-memory strength, respectively. B Active-lever presses during the memory-reactivation session (mean/15 min ± SEM). C Active-lever presses upon first post-treatment re-exposure to the extinction and cocaine-paired contexts at test (mean/2 h ± SEM). Symbols: ANOVA #context simple-main effect, p < 0.001; *treatment simple-main effect, p = 0.02. D Time-course of active-lever presses at test in the cocaine-paired context (mean/20-min interval ± SEM). Symbols: ANOVA †time main effect, Tukey’s tests, interval 1 > intervals 2-6, ps < 0.05; *treatment main effect, p = 0.02. E Inactive-lever presses (mean ± SEM) during the memory-reactivation session (mean/15 min ± SEM). F Inactive-lever presses upon first post-treatment re-exposure to the extinction and cocaine-paired contexts at test (mean/2 h ± SEM). Symbol: ANOVA #context main effect, p = 0.03. G Time-course of inactive-lever presses at test in the cocaine-paired context (mean/20-min interval ± SEM). Symbol: ANOVA †time main effect, Tukey’s tests, interval 1 > intervals 2-6, ps < 0.05. H Representative 10x photomicrographs of the dCA3 stratum lucidum (SL) and stratum pyramidale (SP) of rats in the Laser-OFF and Laser-ON groups. Brain tissue was collected immediately after the test in the cocaine-paired context. Images showing DAPI staining (blue) were used to visualize SL and SP boundaries (see also Fig. S1), and corresponding overlay images were used to visualize eNpHR3.0-eYFP expression (green) and c-Fos immunoreactive (IR) cell bodies (red, arrows). I The density of c-Fos-immunoreactive (IR) neurons was quantified in the area indicated by the blue rectangle on the brain schematic. c-Fos-IR cell body density (mean ± SEM) in the SL and SP of rats in the Laser-ON and Laser-OFF groups. Symbols: *t-tests, ps < 0.05. J Representative 10x photomicrographs of the dCA1 SP of rats in the Laser-OFF and Laser-ON groups. Images showing DAPI staining (blue) were used to visualize SP boundaries and corresponding overlay images were used to visualize eNpHR3.0-eYFP expression (green) and c-Fos IR cell bodies (red, arrows). K The density of c-Fos-IR neurons was quantified in the three areas of the dCA1 as indicated by blue rectangles on the brain schematic. Average c-Fos-IR cell body density (mean ± SEM) in the SP of rats in the Laser-ON and Laser-OFF groups. Symbols: *t-test, p < 0.001.

