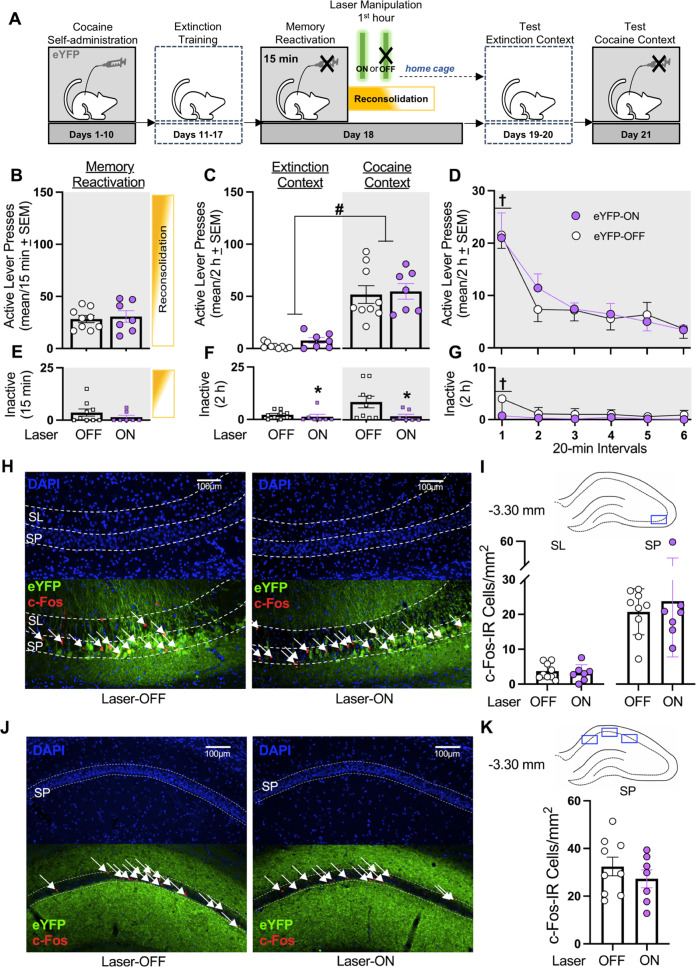
Fig. 2. Laser-ON treatment without eNpHR3.0 expression in the dCA3 does not alter cocaine-memory strength or dCA3 neuronal activity at test.
A Timeline for experiment 2. Following cocaine self-administration and extinction training, eYFP-expressing rats received a 15-min memory-reactivation session, immediately followed by Laser-ON (n = 7) or Laser-OFF (n = 9) treatment for 1 h. Lastly, rats received test sessions in the extinction and cocaine-paired contexts to assess extinction- and cocaine-memory strength, respectively. C Active-lever presses during the memory-reactivation session (mean/15 min ± SEM) and upon first post-treatment re-exposure to the extinction and cocaine-paired contexts at test (mean/2 h ± SEM). Symbols: ANOVA #context main effect, p < 0.001. D Time-course of active-lever presses in the cocaine-paired context at test (mean/20-min interval ± SEM). Symbols: ANOVA †time main effect, Tukey’s test interval 1 > intervals 2-6, ps < 0.05. E Inactive-lever presses (mean ± SEM) during the memory-reactivation session (mean/15 min ± SEM). F Inactive-lever presses upon first post-treatment re-exposure to the extinction and cocaine-paired contexts at test (mean/2 h ± SEM). Symbol: ANOVA #treatment main effect, p = 0.03. G Time-course of inactive-lever presses in the cocaine-paired context at test (mean/20-min interval ± SEM). Symbol: ANOVA †time main effect, Tukey’s test, interval 1 > intervals 2-6, ps < 0.05. H Representative 10x photomicrographs of the dCA3 stratum lucidum (SL) and stratum pyramidale (SP) of rats in the Laser-OFF and Laser-ON groups. Brain tissue was collected immediately after the test in the cocaine-paired context. Images showing DAPI staining (blue) were used to visualize SL and SP boundaries (see also Fig. S1), and corresponding overlay images were used to visualize eYFP expression (green) and c-Fos immunoreactive (IR) cell bodies (red, arrows). I The density of c-Fos-immunoreactive (IR) neurons was quantified in the area corresponding to the blue rectangle on the brain schematic. c-Fos-IR cell body density (mean ± SEM) in the SL and SP of rats in the Laser-ON and Laser-OFF groups. J Representative 10x photomicrographs of the dCA1 SP of rats in the Laser-OFF and Laser-ON groups. Images showing DAPI staining (blue) were used to visualize SP boundaries and corresponding overlay images were used to visualize eNpHR3.0-eYFP expression (green) and c-Fos IR cell bodies (red, arrows). K The density of c-Fos-IR neurons was quantified in the three areas of the dCA1 as indicated by blue rectangles on the brain schematic. Average c-Fos-IR cell body density (mean ± SEM) in the SP of rats in the Laser-ON and Laser-OFF groups. Symbols: *t-test, p < 0.001.

