Figure 7.

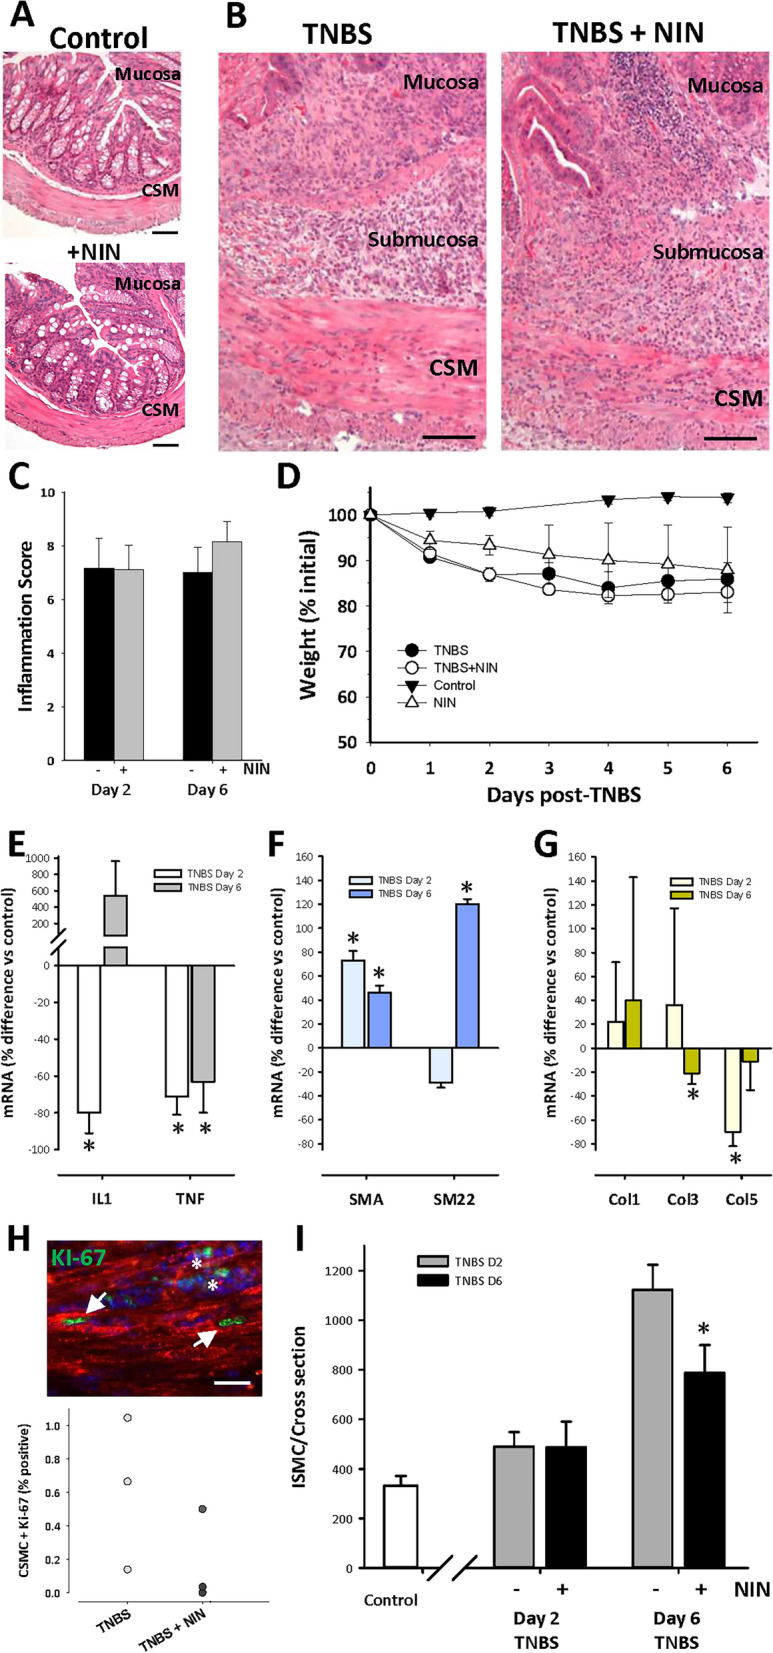
Improved outcomes in TNBS colitis with nintedanib treatment include reduced CSMC growth and increased smooth muscle marker expression. (A,B) Representative low-power micrographs showing similar histology of mid-descending colon in control mice (top) or control mice with nintedanib (lower; 60 mg/kg, p.o. daily). (B) Typical appearance of inflamed colon at Day 6 of TNBS-induced colitis in control TNBS (left) and TNBS + NIN-treated animals (right), showing similar inflammatory damage with diffuse immune infiltrate in the mucosa, submucosa, and smooth muscle layers (CSM, circular smooth muscle). Scale bars: 50 µm (A) and 100 µm (B). (C,D) Lack of effect of NIN treatment on mean tissue damage score at Day 2 or 6 of TNBS colitis (D), or on animal weights during TNBS colitis (D). Note decreasing weight at Days 2 and 6 post-TNBS instillation; p < 0.05 vs control for data > D1. (E–G) Effect of NIN treatment on mRNA levels in smooth muscle/myenteric plexus tissue at Days 2 and 6 of TNBS colitis. (E) Decreased levels of IL-1β and TNFα. (F) Increased levels of mRNA of marker proteins SMA and SM22. (G) No consistent effect on NIN on collagen expression. Data expressed relative to time matched control cohort animals; n = 4–5/condition per time point. *p < 0.05 vs control. (H) Fluorescence image showing growth of CSMC by D2 of TNBS colitis (top), using dual label immunocytochemistry for KI-67 (green) and smooth muscle actin (red) to correlate KI-67 expression with smooth muscle phenotype (arrows) vs immune cells (asterisks). Lower, quantification of KI-67 positive CSMC in Day 2 and Day 2 + NIN mice (n = 3). (I) inhibition of CSMC hyperplasia by NIN during TNBS colitis, with significant reduction of typical threefold increase in CSMC number/cross section by Day 6 (*p < 0.05 vs time-matched colitis control).
