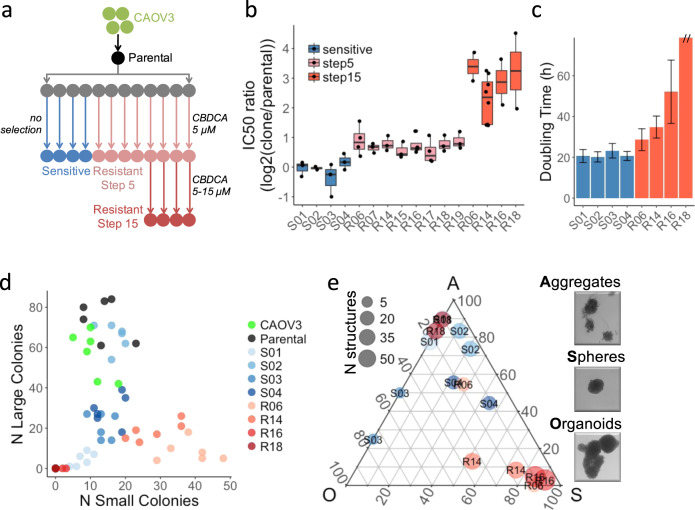
Fig. 1. Phenotypic characterization of the resistant clones.
a Schematic representation of the workflow to generate CBDCA resistant clones from CAOV3. b Changes in IC50 of S clones (unselected) or R clones (8 at step 5 and 4 at step 15). Each IC50 is calculated from dose-response curves of 6 replicates and experiments repeated twice or more (dots). Boxes represent the top and bottom quartiles of the distribution and whiskers are extended to 1.5 time the interquartile range. c Doubling time measured over a 48 h time course—y axis cut for R18 (>100 h). d Counting of colonies formed in a period of 9 days after seeding 200 cells per well. Experimental replicates (N = 6) are shown. e Fraction of organoids (O), spheres (S) and cell aggregates (A) observed after 14 days growth in low adherence 3D culture model. For each sample (N = 8) and replicates (N = 2), the total number (point size) and relative abundance (Gibbs triangle coordinates) of each type of structure are indicated.

