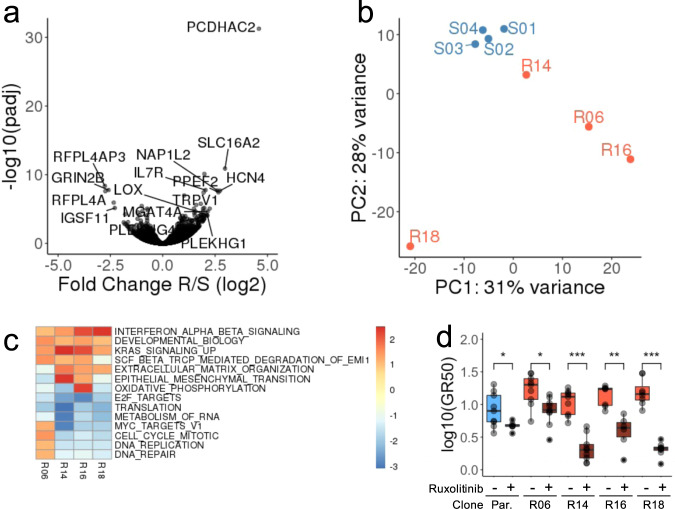
Fig. 2. Expression profiling of the derived clones.
a Volcano plot indicating the fold change (y axis) and significance (x axis) of the genes differentially expressed between S and R clones. b First two principal components derived from the expression profiles of each clone. c Most significantly up or down-regulated gene sets (Hallmark and Reactome from MSigDB) in individual R clones compared to all S clones. Significant gene sets (q < 0.005) enriched (score > 1.5) or depleted (score < −2) in at least one clone are reported. Color gradient indicates enrichment score. d Treatment with 5 µM ruxolitinib (Rux) significantly decreases the growth-rate corrected half maximal inhibitory concentration (GR50) in both Parental and R clones. The results of 3 dose-response experiments, 3 replicates per experiment are presented. Significance was measured using Wilcoxon Test (* < 0.05, ** < 0.01, *** < 0.001). Boxes represent the top and bottom quartiles of the distribution and whiskers are extended to 1.5 time the interquartile range.

