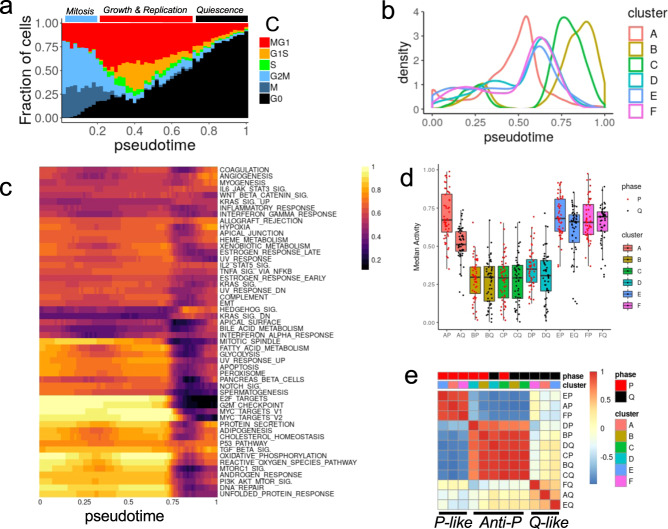
Fig. 4. Functional analyses of single-cell resistant states after in silico synchronization.
a Fraction of cells in each inferred cell cycle phase as a function of the pseudo-time (x axis bins). Three aggregated cell cycle phases are indicated above the plot and determined by bins containing more than 50% of the cells in G2/M or M (mitosis, blue bar, pt < 0.2), in G1S or MG1 (growth and proliferation, red bar, 0.2 ≤ pt < 0.69) or in G0 (quiescence, black bar pt ≥ 0.69). b The distribution of cells (kernel density – y axis) along the pseudo-time trajectory (x axis) is represented for each expression-based clustering. c Scaled enrichment score (ES) of the hallmark gene sets (clustered rows) observed in cluster A cells as a function of pseudo-time (columns). d Median scaled enrichment score of all hallmark gene sets across cells from P (red points) and Q (black points) phases for each of the 6 clusters. Boxes represent the top and bottom quartiles of the distribution and whiskers are extended to 1.5 time the interquartile range. e Correlation of hallmark gene sets median scaled enrichment score for all clusters and proliferation phases.

