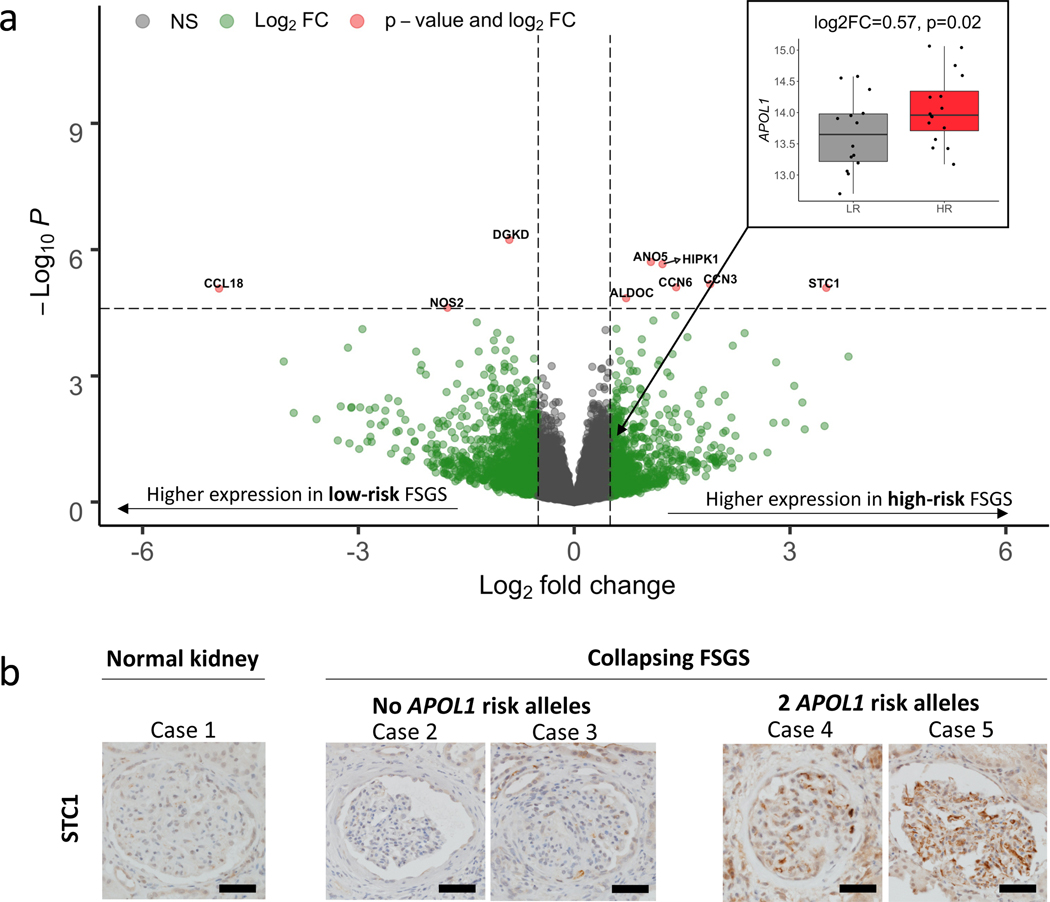
Figure 2 -. Differential expression volcano plot:
a) Genes (represented as dots) up-regulated in high-risk samples, as compared to low-risk samples, are indicated with positive log2 fold change. Vertical hashed bars indicate log2 fold change of −0.5 and 0.5, which we define as the threshold for differential expression. The horizontal hashed bar indicates the adjusted significant p-value threshold 0.05 (Punadjusted ~ 2.5×10⁻⁵). Red dots identify the nine genes that passed the multiple testing correction with absolute fold change > 0.5. Green dots are differentially expressed genes that do not pass our significance threshold. Insert - Differential expression of APOL1 in the low risk (gray) and high risk (red) states. b) Differences in glomerular immunohistochemical staining of STC1 in the normal human kidney compared to biopsies of patients with Collapsing FSGS and zero or two confirmed APOL1 risk alleles. Most-preserved glomeruli are captured. STC1 is only weakly expressed in normal glomeruli and in glomeruli of patients with collapsing FSGS and wildtype APOL1 risk alleles. In contrast, patients with FSGS with collapsing features and two APOL1 risk alleles show increased glomerular staining, diffusely detected in the glomerular endothelium. No definitive staining was seen in podocytes. Scale bars: 50mm.

