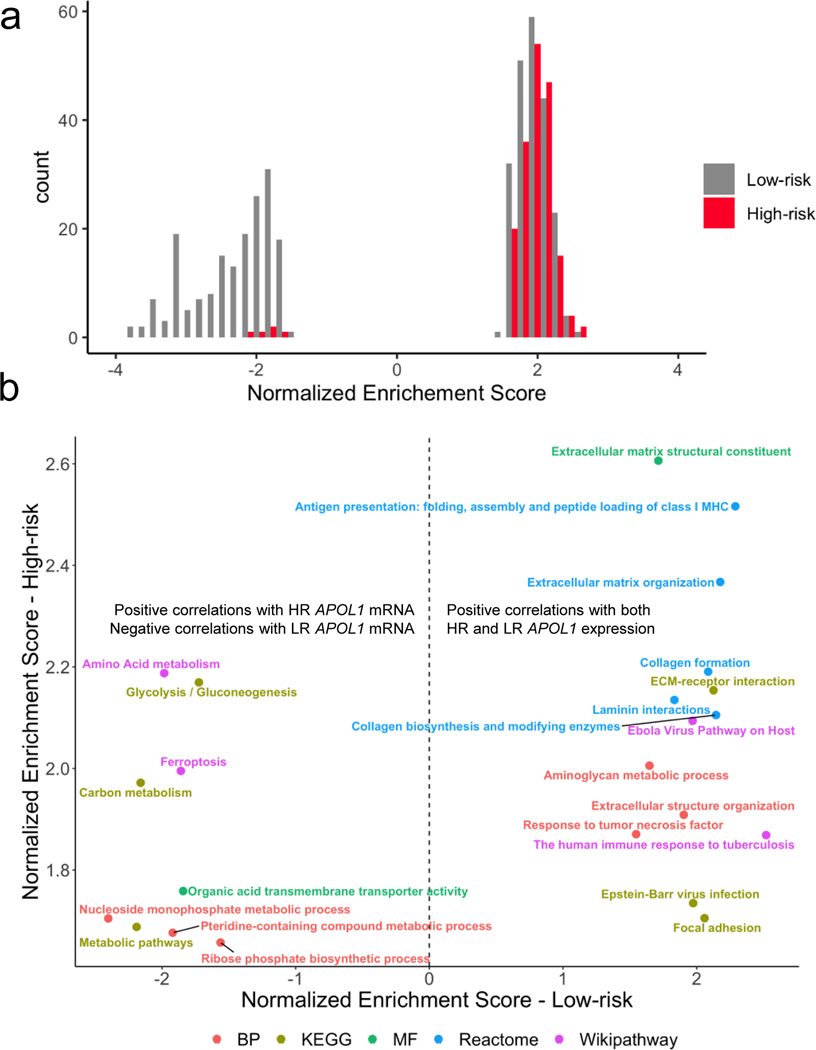
Figure 4 -. APOL1 genome-wide correlations:
a) Histogram of gene set enrichment analysis (GSEA) normalized enrichment scores (NES) with FDR < 0.05, stratified by risk genotype. Enrichments among genes negatively correlated with APOL1 are indicated by a negative NES, and enrichments among genes positively correlated with APOL1 are indicated by a positive NES. In the low risk (LR) group, there was enrichment among genes positively and negatively correlated with APOL1. In high risk (HR), most enrichments were among genes positively correlated with APOL1 expression. b) Comparison of enrichment terms common to both HR and LR FSGS colored by gene annotation dataset. Annotations to the right of the hashed line indicate gene sets enriched among genes positively correlated with both HR and LR APOL1 expression. Annotations to the left of the hashed line indicate gene sets negatively correlated with LR APOL1 expression and positively correlated with HR APOL1 expression.

