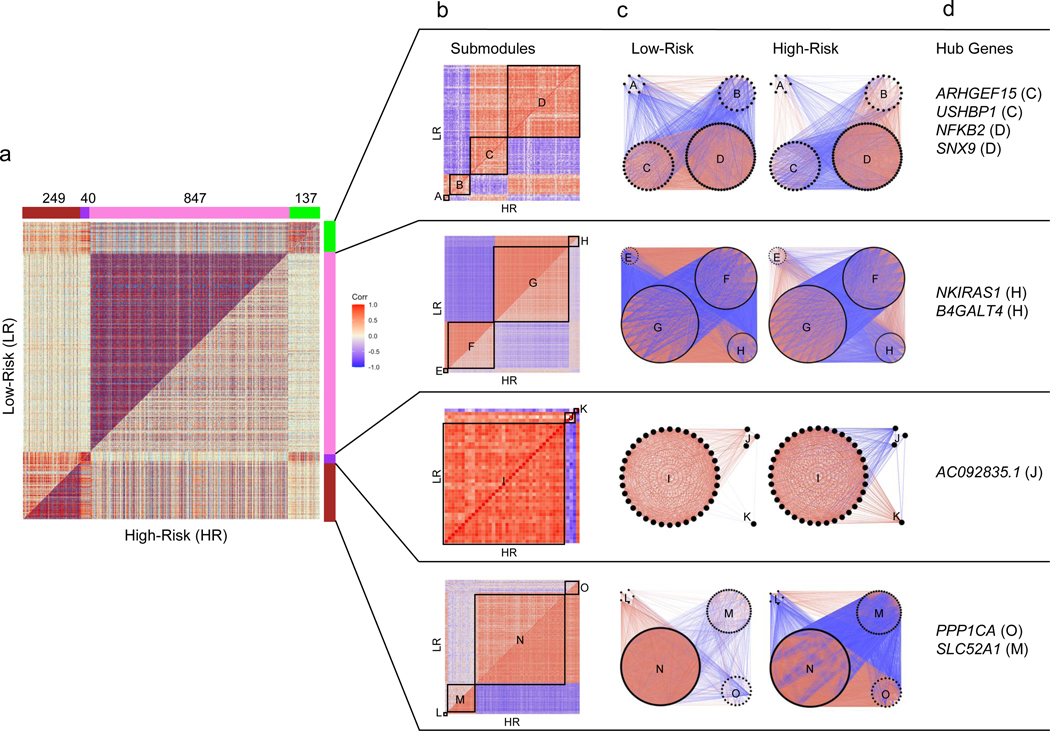
Figure 5 -. Differential co-expression analysis of 15,703 protein-coding genes in high-risk versus low-risk FSGS:

(Positive correlations are red and negative are blue throughout all figures). a) Symmetric correlation heatmap of differentially co-expressed genes grouped into four modules (“Brown,” “Purple,” “Pink,” “Green”). Each row and column is a single gene. The upper triangle (above the diagonal) reflects correlations in the low risk (LR) samples, and the lower triangle (below the diagonal) the high risk (HR) samples. The number of genes in each module is indicated above the module color. b) Submodule correlation heatmaps for each differentially co-expressed gene module, identified by hierarchical clustering of module genes in each group. LR correlations are reflected on the upper triangle and HR on the bottom. Submodules are labeled alphabetically. c) Gene network view of correlations within and between gene submodules stratified by risk genotype. d) Hub genes (most differentially co-expressed genes), for each module with the corresponding submodule label. Genes with a normalized connectivity > 0.7 were considered hub genes.
