Figure 4.
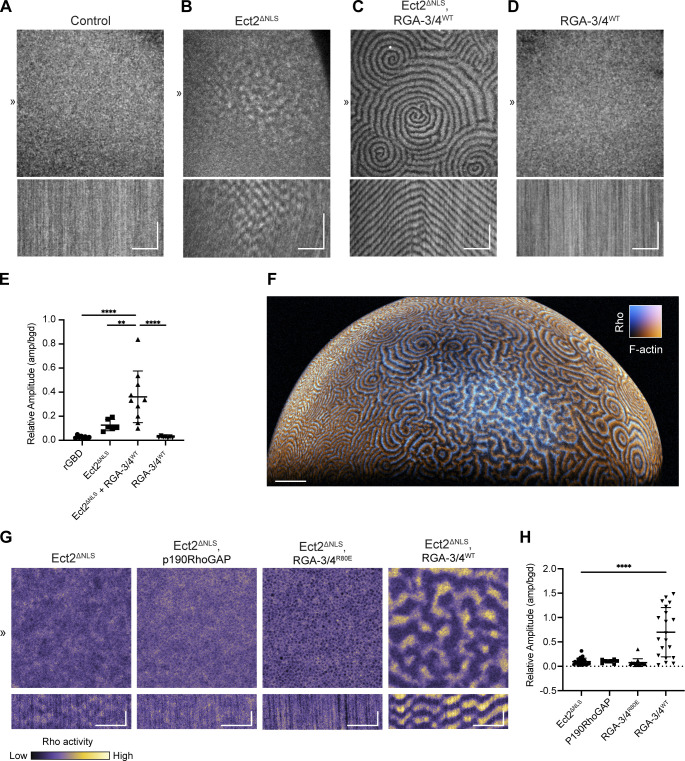
Coexpression of Ect2 and RGA-3/4 induces high-level excitability in immature frog oocytes. (A–D) Still frames (top) and kymographs (bottom) from representative oocytes expressing probe for active Rho (GFP-rGBD). Kymographs generated from 1-px line drawn at position ≫. Kymograph x scale also applies to still images; x scale bar = 50 µm, y scale bar = 5 min; see also Video 8. (A) Control oocyte expressing only active Rho probe shows no waves. (B) Oocyte expressing untagged, nonimportable Ect2 (Ect2ΔNLS) shows isolated, low-amplitude Rho waves. (C) Oocyte expressing Ect2ΔNLS and RGA-3/4WT shows high-amplitude waves with multiple spiral cores and continuous waves across cortex. (D) Oocyte expressing RGA-3/4WT alone shows no waves. (E) Quantification of relative wave amplitude across conditions in A–D. Each dot represents a single oocyte; group mean ± SD. One-way ANOVA with Tukey post hoc test for multiple comparisons; data distribution was assumed to be normal but was not formally tested; **, P < 0.01; ****, P < 0.0001; control, n = 8; Ect2ΔNLS, n = 6; Ect2 ΔNLS + RGA-3/4WT, n = 10; RGA-3/4WT, n = 7; six experiments. (F) Light-sheet imaging of immature oocyte expressing Ect2ΔNLS and RGA-3/4WT shows cortical waves present over entire animal cortex; scale bar = 100 µm; see also Video 9. (G) All oocytes express probe for active Rho (GFP-rGBD) and Ect2ΔNLS. Expression of p190RhoGAP (panel 2) or RGA-3/4 R80E (panel 3) do not support high-level cortical excitability; kymograph x scale also applies to still images; x scale bar = 25 µm, y scale bar = 2 min. (H) Quantification of relative wave amplitude across experimental groups described in G. Each dot represents a single oocyte; group mean ± SD. One-way ANOVA with Tukey post hoc test for multiple comparisons; ****, P < 0.0001; Ect2ΔNLS, n = 27; p190RhoGAP, n = 9; RGA-3/4R80E, n = 16; RGA-3/4WT, n = 21; five experiments.

