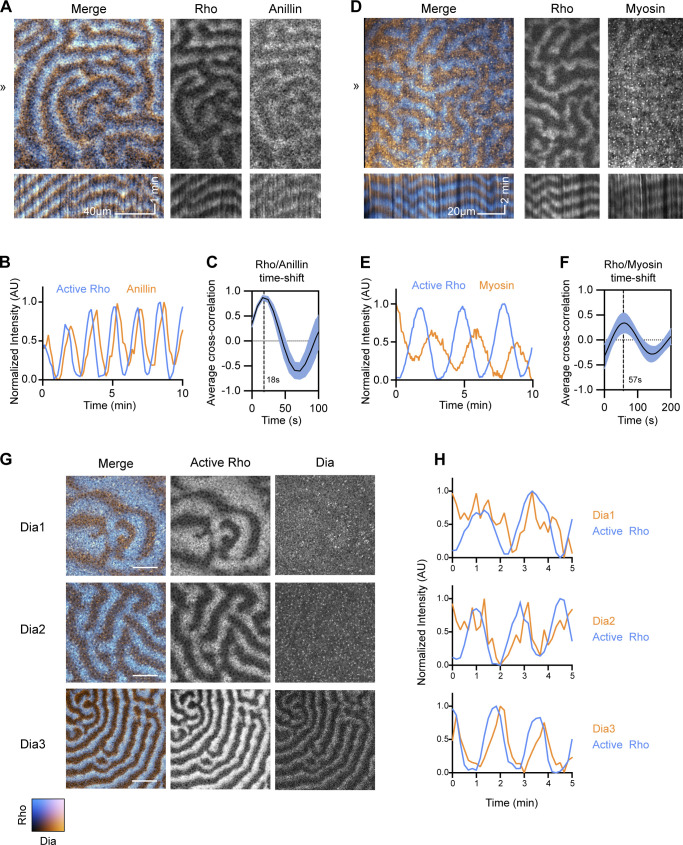
Figure 6.
Recruitment of cytokinetic participants to immature oocyte waves. All oocytes express untagged Ect2ΔNLS and RGA-3/4WT to generate cortical waves. (A) Frog oocyte expressing probe for active Rho (cyan; mCherry-rGBD) and tagged anillin (orange; Anillin-3xGFP). Kymographs (bottom) generated from 1-px line drawn at position ≫. Kymograph x scale also applies to still images; x scale bar = 40 µm; y scale bar = 1 min. (B) Representative intensity profile of active Rho and anillin. (C) Cross-correlational analysis of cell in A showing 18-s delay between Rho activation and anillin recruitment. (D) Waving frog oocyte expressing probes for active Rho (cyan; mCherry-rGBD) and myosin (orange; Sf9-mNeon). Kymographs (bottom) generated from 1-px line drawn at position ≫. Kymograph x scale also applies to still images; x scale bar = 20 µm; y scale bar = 2 min. (E) Representative intensity profile of Rho and myosin dynamics for cell in D. (F) Cross-correlational analysis of cell in D showing 57-s delay between Rho activation and Myosin recruitment. (G) Still frames of oocytes expressing probe for active Rho (cyan; mCherry-rGBD) and tagged Xenopus Dias 1, 2, or 3 (orange; Dia1-3xGFP, Dia2-3xGFP, Dia3-3xGFP). Only Dia3 is recruited robustly to cortical waves. Scale bar = 25 µm. (H) Representative intensity profiles of active Rho (cyan) with Dias 1, 2, and 3 (orange).

