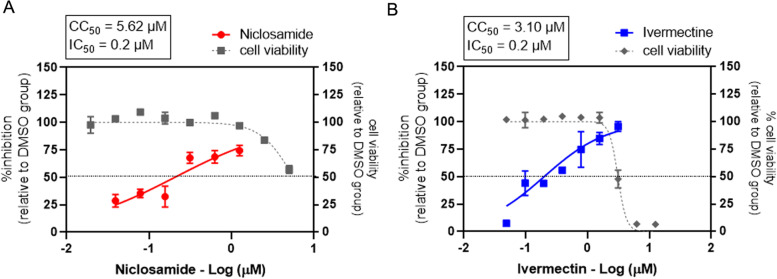
Fig. 5.
Single drug treatment against SARS-CoV-2 in Calu-3 cells. The dose-response curves of a single drug treatment against SARS-CoV-2 in Calu-3 cells are shown; (A) niclosamide, and (B) ivermectin. Calu-3 cells were treated with twofold serial dilutions of drug for 1 hour and followed by SARS-CoV-2 infection at 500 TCID50. Then the cells were maintained in the medium containing drugs or 0.5%DMSO for two days. Virus titers were determined using the plaque assay. The dose-response curves were expressed as the percent inhibition in relative to DMSO-treated cell control. The cell viability was determined using MTT assay and is expressed in relative to the DMSO-treated cell control. The experiments were repeated at least three times, and data are shown as mean ± SD

