. 2022 Jun 3;6(6):e34566. doi: 10.2196/34566
©Minh Tam Truong, Obioma Bertrand Nwosu, Maria Elena Gaytan Torres, Maria Paula Segura Vargas, Ann-Kristin Seifer, Marlies Nitschke, Alzhraa A Ibrahim, Johannes Knitza, Martin Krusche, Bjoern M Eskofier, Georg Schett, Harriet Morf. Originally published in JMIR Formative Research (https://formative.jmir.org), 03.06.2022.
This is an open-access article distributed under the terms of the Creative Commons Attribution License (https://creativecommons.org/licenses/by/4.0/), which permits unrestricted use, distribution, and reproduction in any medium, provided the original work, first published in JMIR Formative Research, is properly cited. The complete bibliographic information, a link to the original publication on https://formative.jmir.org, as well as this copyright and license information must be included.
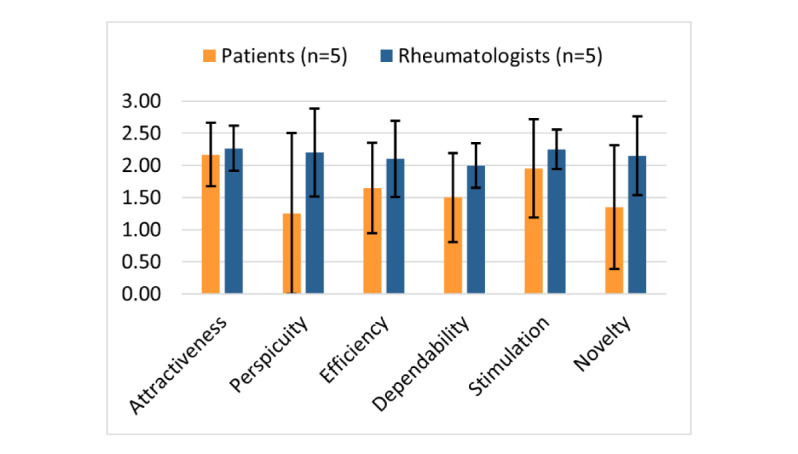
Figure 3.

User Experience Questionnaire scale means depending on the participant group. The error bars represent the 95% CIs of the scale mean.
