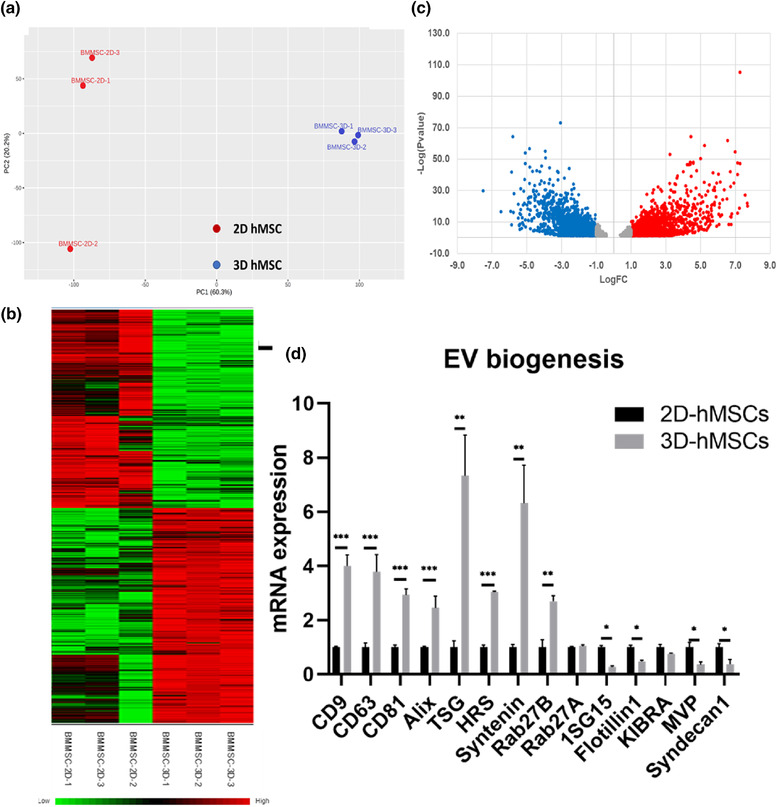
FIGURE 2.

mRNA sequencing of 2D vs. 3D hMSCs and EV biogenesis marker expression. (a) Principal component analysis (PCA) plots of different culture conditions (2D and 3D) in triplicate. (b) Heatmap of differentially expressed genes (DEGs) from mRNA sequencing. (c) Volcano plots illustrate the number of significant DEGs (3D/2D). Red colour symbols indicate the upregulated DEGs and blue symbols indicate the downregulated DEGs. (d) Genes involved in EV biogenesis and secretion pathways in hMSCs determined by qRT‐PCR. n = 3. *P < 0.05; **P < 0.01; ***P < 0.001
