
Figure 1: Relative quantification of truncation at Gln and Glu in middle-aged normal human lenses.
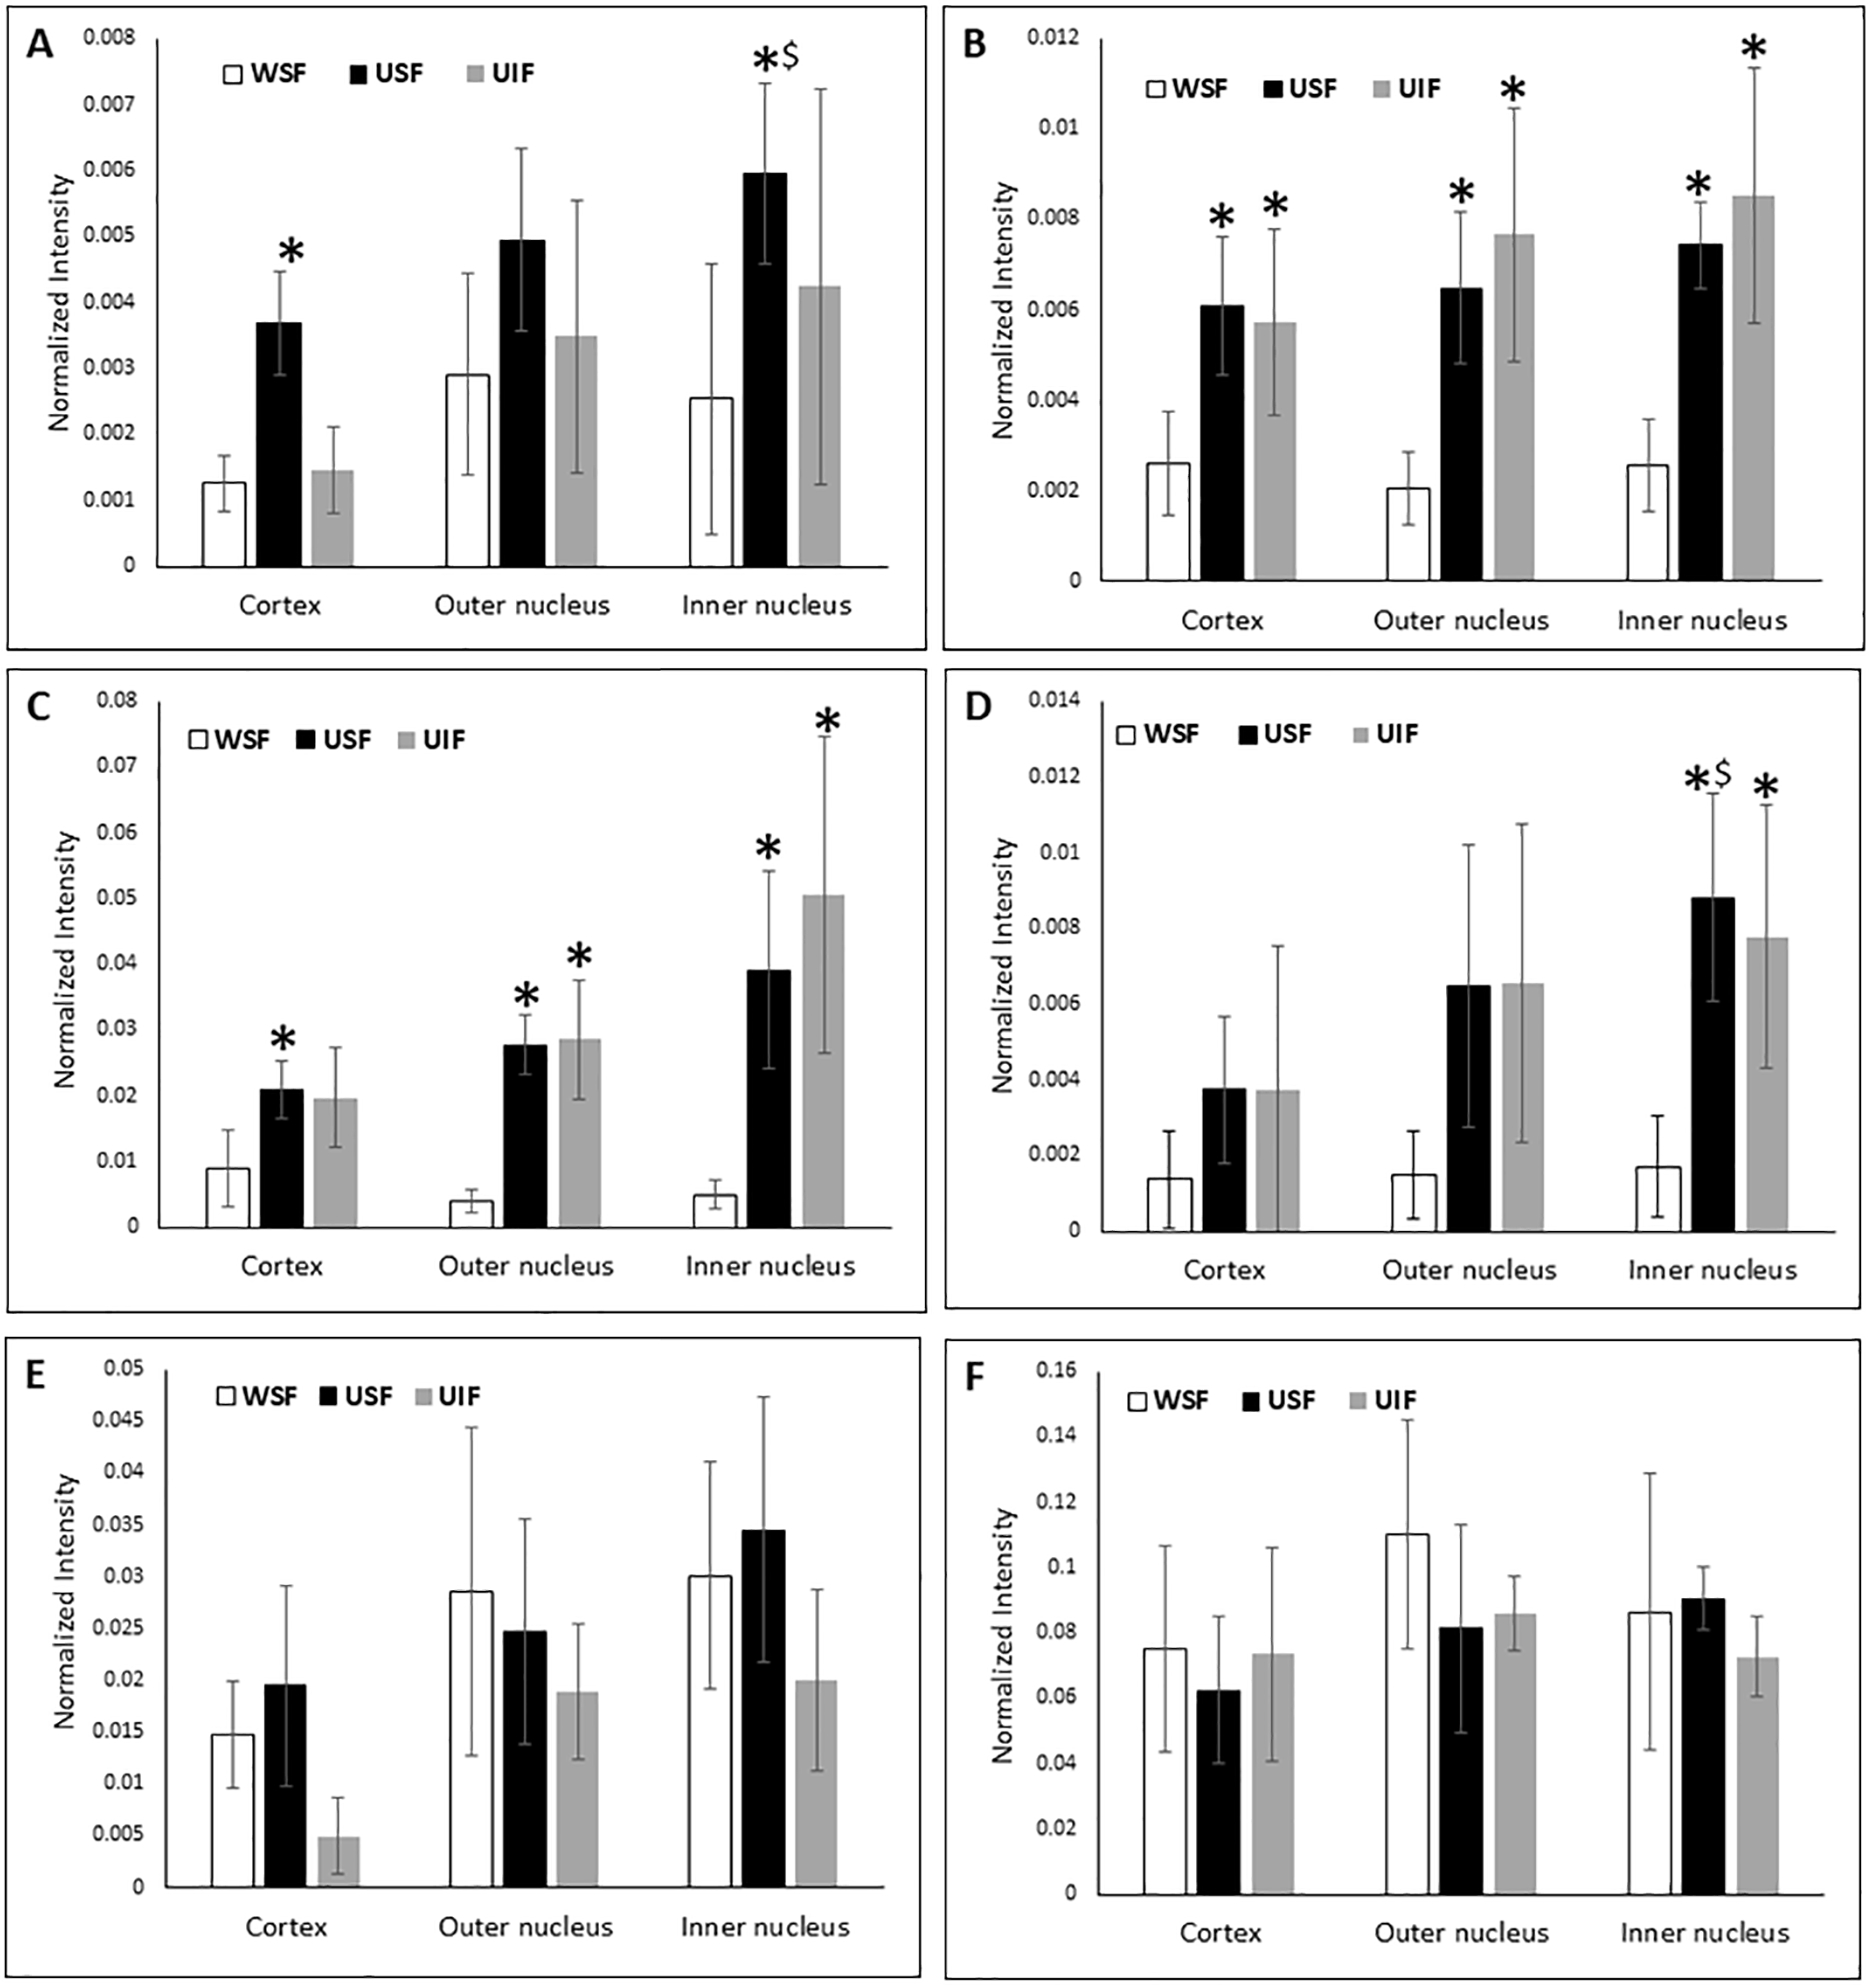
Relative truncation of αA E165 (A), αA E156 (B), βA3 Q208 (C), βA4 Q189 (D), βB1 E249 (E) and βB2 Q197 (F) in different regions of middle-aged normal human lenses. * indicates a statistically significant difference in truncation compared with WSF of the same regions of the lens (p < 0.05). $ indicates a statistically significant difference in truncation compared with cortex region of the lens. The error bars indicate standard deviation of four biological replicates (WSF = Water soluble fraction, USF = Urea soluble fraction and UIF=Urea insoluble fraction.)