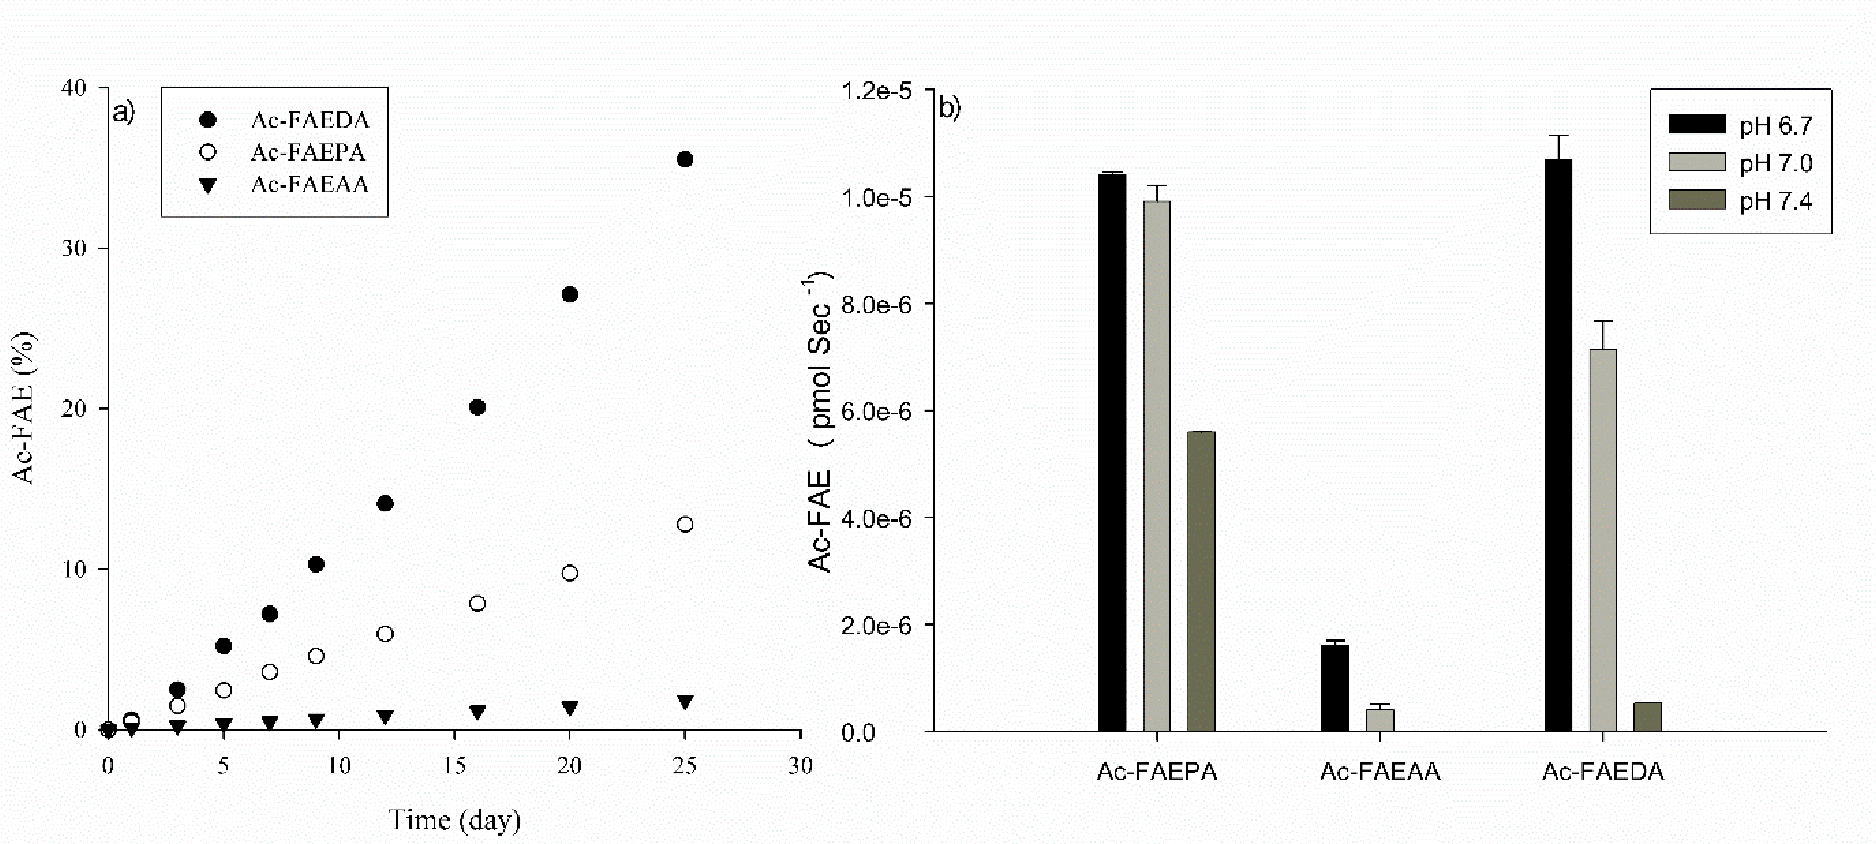
Figure 4. Cleavage on the C-terminal side of Glu in Ac-FAEDA, Ac-FAEPA and Ac-FAEAA.

a) Time course of Ac-FAE from the three peptides at pH 4.0. Ac-FAE formation was calculated as a percentage of total HPLC peak area b) Apparent rate of Glu cleavage in Ac-FAEDA Ac-FAEPA and Ac-FAEAA incubated at pH 6.7, 7.0 and 7.4. Cleavage rate was determined by the slope of the curve over a 25 day incubation period. All samples were run in triplicate at 60°C. Error bars +/− SD.
