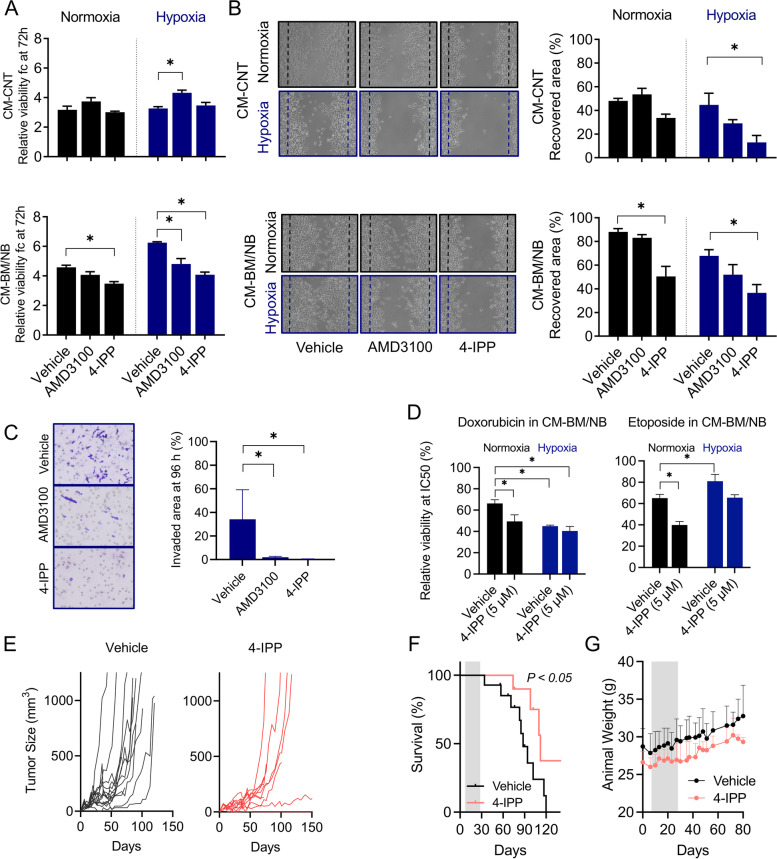
Fig. 7.
Impairing NB aggressive phenotypes with MIF and CXCR4 inhibitors. A) Cell viability after exposure to CM-CNT or CM-BM/NB and treatments (vehicle, 10 nM AMD3100 and 5 μM 4-IPP) at 72 h. Data is represented as a fold-change viability to time 0 h (n = 3). Significances were obtained after comparing vehicle vs treatments. One-way Anova Kruskal-Wallis test. B) Images (10x) and graph bar quantification of LAN-1 wound healing recovery under CM-CNT and CM-BM/NB normoxia and hypoxia (vehicle, 10 nM AMD3100 and 5 μM 4-IPP) at 24 h. Two-way Anova Sidaks’s multiple comparison test. C) Images and graph bars of invaded cells with 5 μM 4-IPP or 10 nM AMD3100, under CM-BM/NB normoxia (black) and hypoxia (blue) at 96 h. One-way Anova Kruskal-Wallis test. * P < 0.05. D) Cytotoxicity of chemotherapy compounds, doxorubicin and etoposide, in LAN-1 cells cultured with CM-BM/NB at 72 h together with 5 μM of 4-IPP or vehicle. Bar graph with relative viability at CM-BM/NB for doxorubicin and etoposide IC50. Normoxia (black), hypoxia (blue). Two-way Anova, Dunnett’s multiple comparison test. (n = 3) (*) P < 0.05. E) Individual tumor growth in vehicle and 4-IPP treated group. F) Tumor survival curves for each group. Events were reported when tumor size reached 1000 mm3. G) Body weight variation of mice during treatment (grey area) and follow-up

