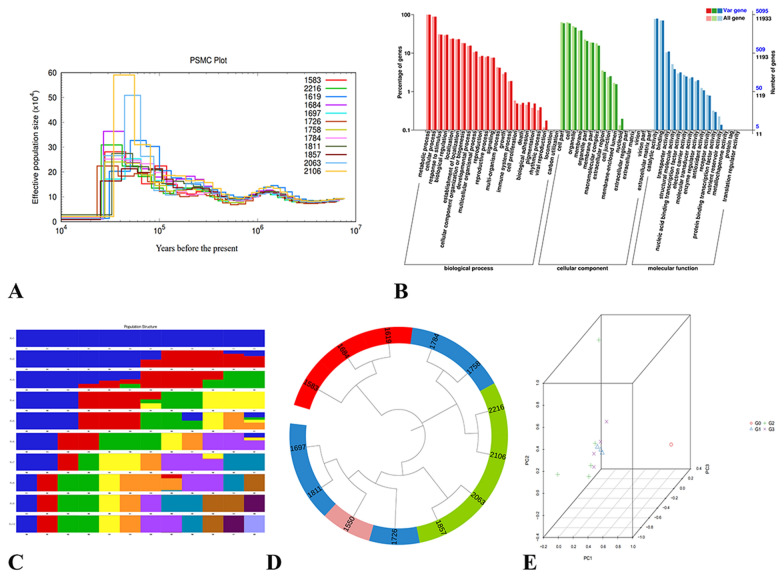
Fig. 5.
Resequencing analysis. A Demographic history of 12 wild E. angustifolia samples. B GO annotation clustering of variant genes in sample R01. C Sample clustering results corresponding to each K value of Admixture. D Phylogenetic trees of 12 wild E. angustifolia samples and outgroup Z. jujuba. The numbers (1583, 1619, 1684, 1697, 1726, 1758, 1784, 1811, 1857, 2063, 2106, 2216) represent the Sample IDs of 12 wild E. angustifolia samples, and the number ‘1550’ represents the outgroup Z. jujuba. The color of G0, G1, G2, and G3 was purple, red, blue, and green. respectively. E Three-way PCA plot of E. angustifolia and Z. jujuba

