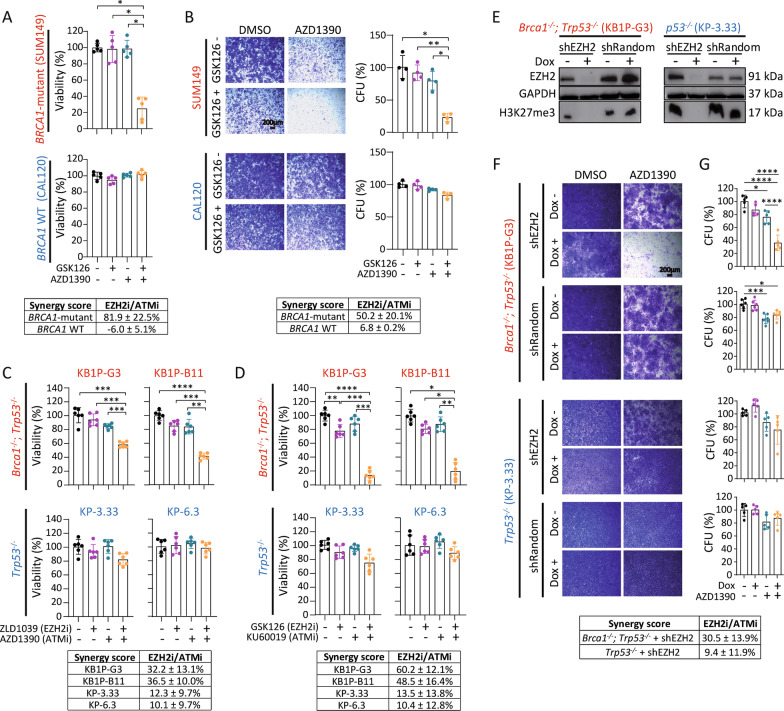
Fig. 4.
Validation of synergistic EZH2/ATM inhibition using human TNBC cells, chemically distinct inhibitors and genetic knockdown. A Cell viability assay showing increased cytotoxicity using combined GSK126 (7.5 µM) and AZD1390 (2.5 µM) for 72 h in BRCA1-mutant SUM149 (upper panel, Bliss synergy score: 81.9 ± 22.5%) compared to BRCA1-wild type CAL120 (lower panel, synergy score: −6.0 ± 5.1%) human breast cancer cells. Bars presented as mean ± SD of five independent experiments. B Colony formation assay in BRCA1-mutant (SUM149) and BRCA1-wild type (CAL120) human TNBC cells after 7 days of incubation with GSK126 (7.5 µM) and AZD1390 (2.5 µM). Left panels: Representative microscopic images of colony formation at 0.65× magnification. Scale bar 200 µm. Right panels: Quantification of crystal violet positive stained cells is presented as mean ± SD of four independent experiments. Calculation of drug synergy using the Bliss independence score revealed a mean synergy score of 50.2 ± 20.1% in SUM149 cells, 6.8 ± 0.2% in CAL120 cells. C, D The synergistic cytotoxic effect is also evident for chemically distinct inhibitors of EZH2 and ATM. The BRCA1-deficient (KB1P-G3 and KB1P-B11) and BRCA1-proficient (KP-3.33 and KP-6.3) cell lines were treated with C ZLD1039 (3 µM) as an alternative inhibitor against EZH2 alone or in combination with AZD1390 (5 µM), or D KU60019 (5 µM) as an alternative inhibitor against ATM alone or in combination with GSK126 (7.5 µM), respectively. After 72 h, cell viability was quantified by CellTiter-Glo assay. Data are presented as mean ± SD of at least four independent experiments. Bliss synergy score for ZLD1039/AZD1390: KB1P-G3: 32.2 ± 13.1%; KB1P-B11: 36.5 ± 10.0%; KP-3.33: 12.3 ± 9.7%; KP-6.3: 10.1 ± 9.7%. Bliss synergy score for GSK126/KU60019: KB1P-G3: 60.2 ± 12.1%; KB1P-B11: 48.5 ± 16.4%; KP-3.33: 13.5 ± 13.8%; KP-6.3: 10.4 ± 12.8%. E–G Genetic ablation of EZH2 mimics pharmacological H3K27me3 inhibition. E Immunoblotting showing reduced EZH2 expression and reduced H3K27me3 levels upon inducible EZH2 knockdown after 7 days of Dox treatment (100 ng/µl) compared to PBS control treatment. F Representative microscopic images of colony formation assay after 7 days of incubation using Dox-induced EZH2 knockdown and 2 µM AZD1390 in KB1P-G3 and KP-3.33-shEZH2 cells are shown at 0.65× magnification. Scale bar 200 µm. G Quantification of crystal violet positive stained colonies is presented as mean ± SD of five independent experiments. Bliss synergy score: KB1P-G3-shEZH2: 30.5 ± 13.9%; KP-3.33-shEZH22: 9.4 ± 11.9%. Significance was tested by one-way ANOVA with Tukey multiple comparison test. CFU colony forming unit

