Fig. 5.
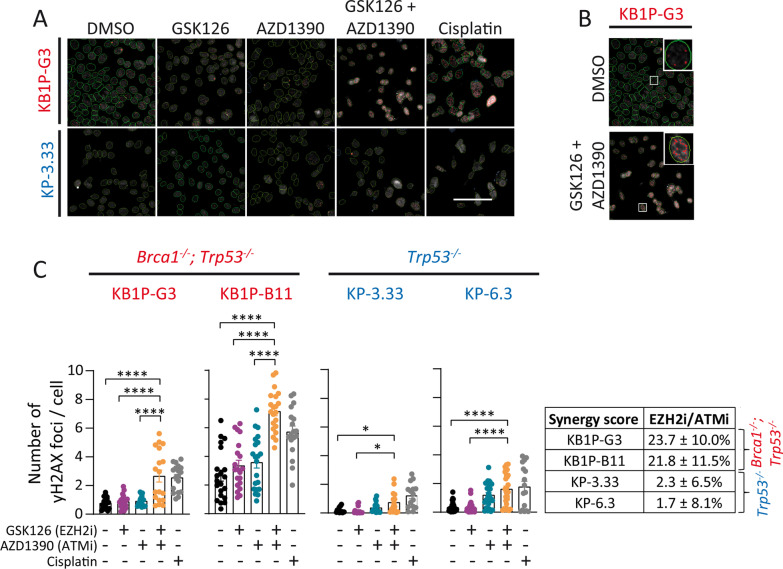
Combined inhibition of EZH2/ATM induces genotoxic stress. A Representative microscopic images of immunofluorescence staining of γH2AX in the nucleus of cells exposed to 7.5 µM GSK126 and 2 µM AZD1390 for 48 h. Treatment with 1 µM cisplatin was used as positive control. Green or blue encircled cells indicate inclusion or exclusion of objects. Red indicates detected yH2AX foci. Scale bar 100 µm. B Magnified inset of a representative KB1P-G3 cell with (top) high number of yH2AX foci per cell after combined EZH2/ATM inhibition and (bottom) low number of yH2AX foci per cell after DMSO treatment. C Quantification of immunofluorescence staining. Values are mean ± SEM of at least four independent experiments with each three technical replicates. Bliss synergy score: KB1P-G3: 23.7 ± 10.0%; KB1P-B11: 21.8 ± 11.5%; KP-3.33: 2.3 ± 6.5%; KP-6.3: 1.7 ± 8.1%. See Additional file 4: Fig. S4 for bar graphs showing cells per field (upper panels) and numbers of analyzed cells per condition (lower panels). Significance was tested by one-way ANOVA with Tukey multiple comparison test

