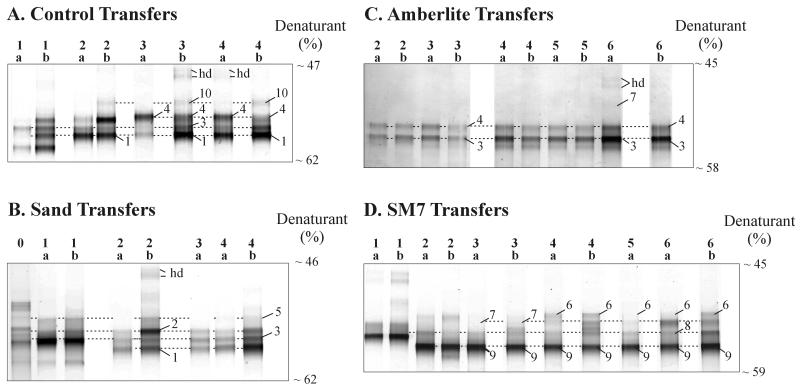
FIG. 1.
DGGE analysis of PCR-amplified 16S rRNA gene segments from replicates (labeled a and b) after sequential transfers (numbers above the lanes) of enrichment cultures inoculated with Dover, Ohio, soil. (A) Control. (B) Sand. (C) AMB. (D) SM7. The band numbers correspond to those in Tables 1 and 2. The dashed lines are included to help visualize comigrating bands. hd, heteroduplex bands.

