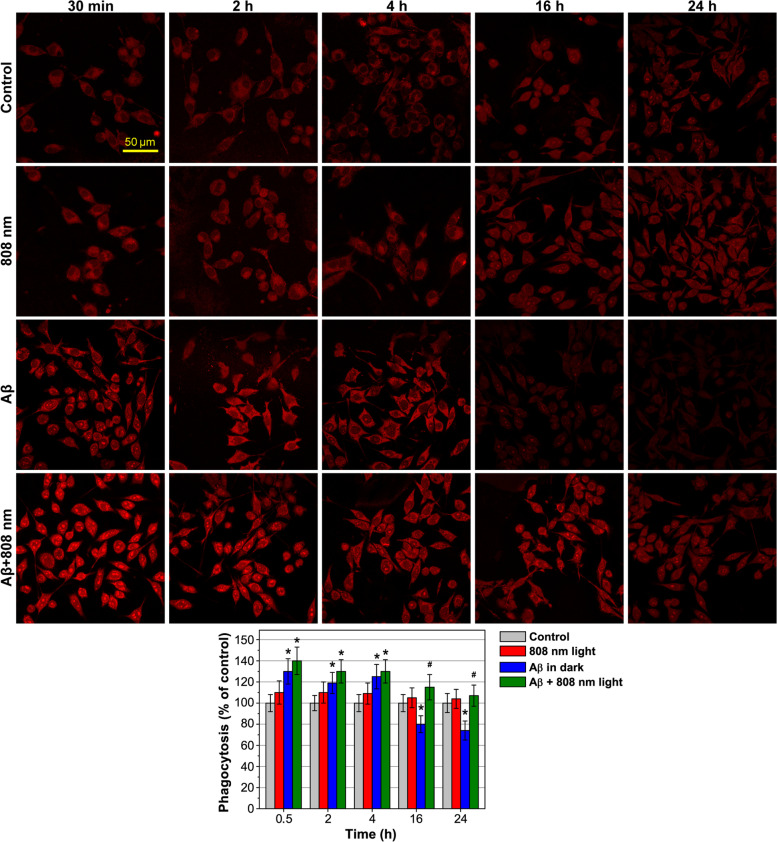
Fig. 2.
NIR light activation phagocytosis of Aβ-treated microglia cells. Changes in the fluorescence signal from Aβ following stimulation by non-fluorescent Aβ, low-intensity light at 808 nm with 10 J/cm2, and both Aβ and light over time was recorded. The representative transmission microscopy images show phagocytosis of Aβ by microglia after 30 min, 2 h, 4 h, 16 h, and 24 h. The enlarged brightfield and merged images are presented in Fig. S4, Supplementary Materials. The data are presented as the mean ± SD (n = 6 replicates in each group); *p < 0.05 indicates data with a statistically significant difference evaluated in relation to the control level, and #p < 0.05 indicates data with a statistically significant difference evaluated in relation to the level during co-cultivation with Aβ-treated microglia (two-way ANOVA test)

