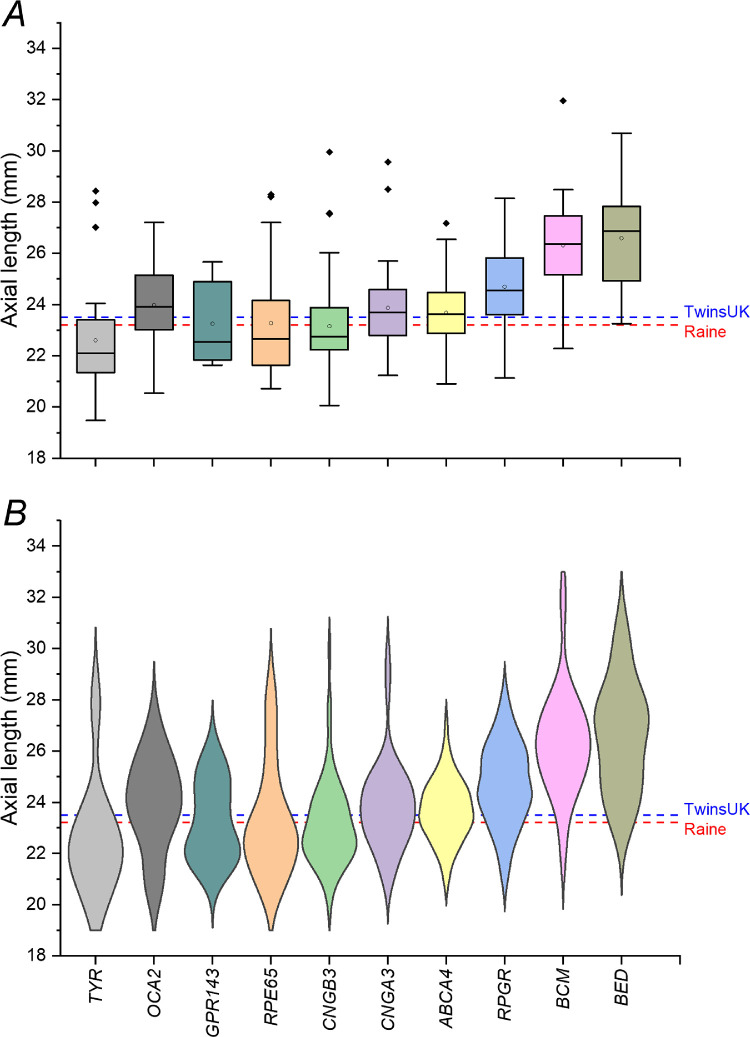
Figure 1.
Axial lengths in inherited retinal diseases for which there were more than 10 participants. (A) Boxplots (open circles denote means; filled diamonds denote outliers). (B) Violin plots. Dashed lines show mean ALs for the TwinsUK and Raine Study cohorts as labeled. Compared with the reference cohorts, average ALs were clearly longer in BCM, BED, and RPGR- and OCA2-associated disease.

