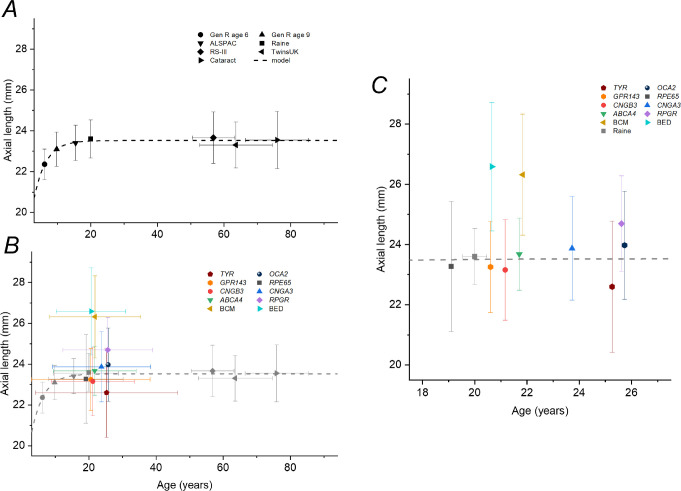
Figure 3.
Mean ALs plotted against average age for reference cohorts and IRD patients. (A) Mean ALs for a number of reference cohorts of different ages. Horizontal and vertical error bars show standard deviations. The dashed curve plots an exponential recovery relation fitted empirically to the data. Note that, because these are not longitudinal data, there will be a cohort effect (with increasing prevalence of myopia in many populations), so the younger individuals are likely in the future to have longer eyes when they reach the age of the older cohorts in comparison to those cohorts. (B) Data for IRD subgroups (colored symbols) superimposed on reference data (here shown in gray). (C) Data from (B) are replotted with an expanded x-axis covering the mean ages of the patient cohorts and with the horizontal error bars for the patient cohorts removed to aid clarity.

