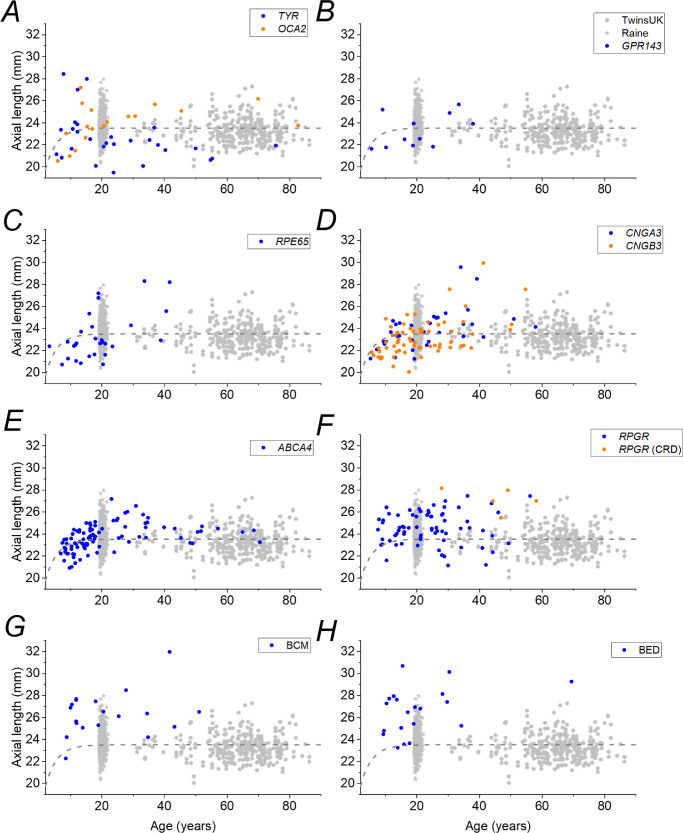
Figure 4.
Axial lengths plotted against age for individual participants in each IRD group. Blue symbols plot data for IRD patients as follows: (A) TYR-associated albinism (orange symbols for OCA2-associated albinism); (B) GPR143-associated ocular albinism; (C) RPE65-associated disease; (D) CNGA3-associated achromatopsia (orange symbols for CNGB3-associated achromatopsia); (E) ABCA4-associated retinopathy (Stargardt disease); (F) RPGR-associated disease (orange symbols for cone–rod disease); (G) BCM; and (H) BED. Gray hexagons and stars in each panel show distributions for the TwinsUK and Raine Study cohorts, respectively. The dashed curve in each panel re-plots empirical relations describing reference data in Figure 3.

