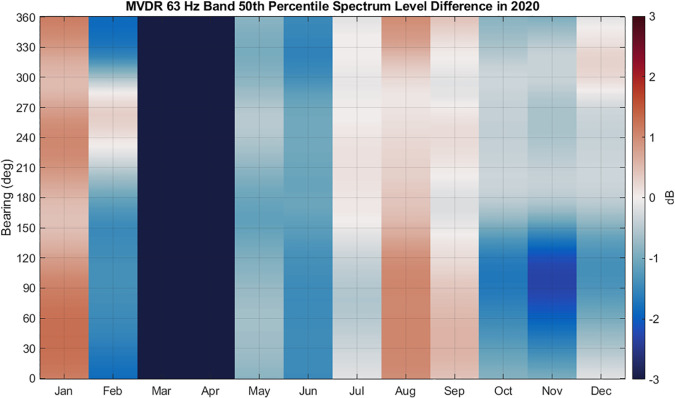
FIG. 16.
(Color online) 63 Hz 1/3 octave band MVDR 50th percentile spectrum level year-to-year differences. Red indicates an increase in noise level from 2019 to 2020, and blue indicates a decrease in noise level. January data compares 2020 to 2021, since data were not available for January 2019. Vector sensor processing reveals the directional dependence of the ambient noise changes, which is lost when measuring noise with a single hydrophone.

