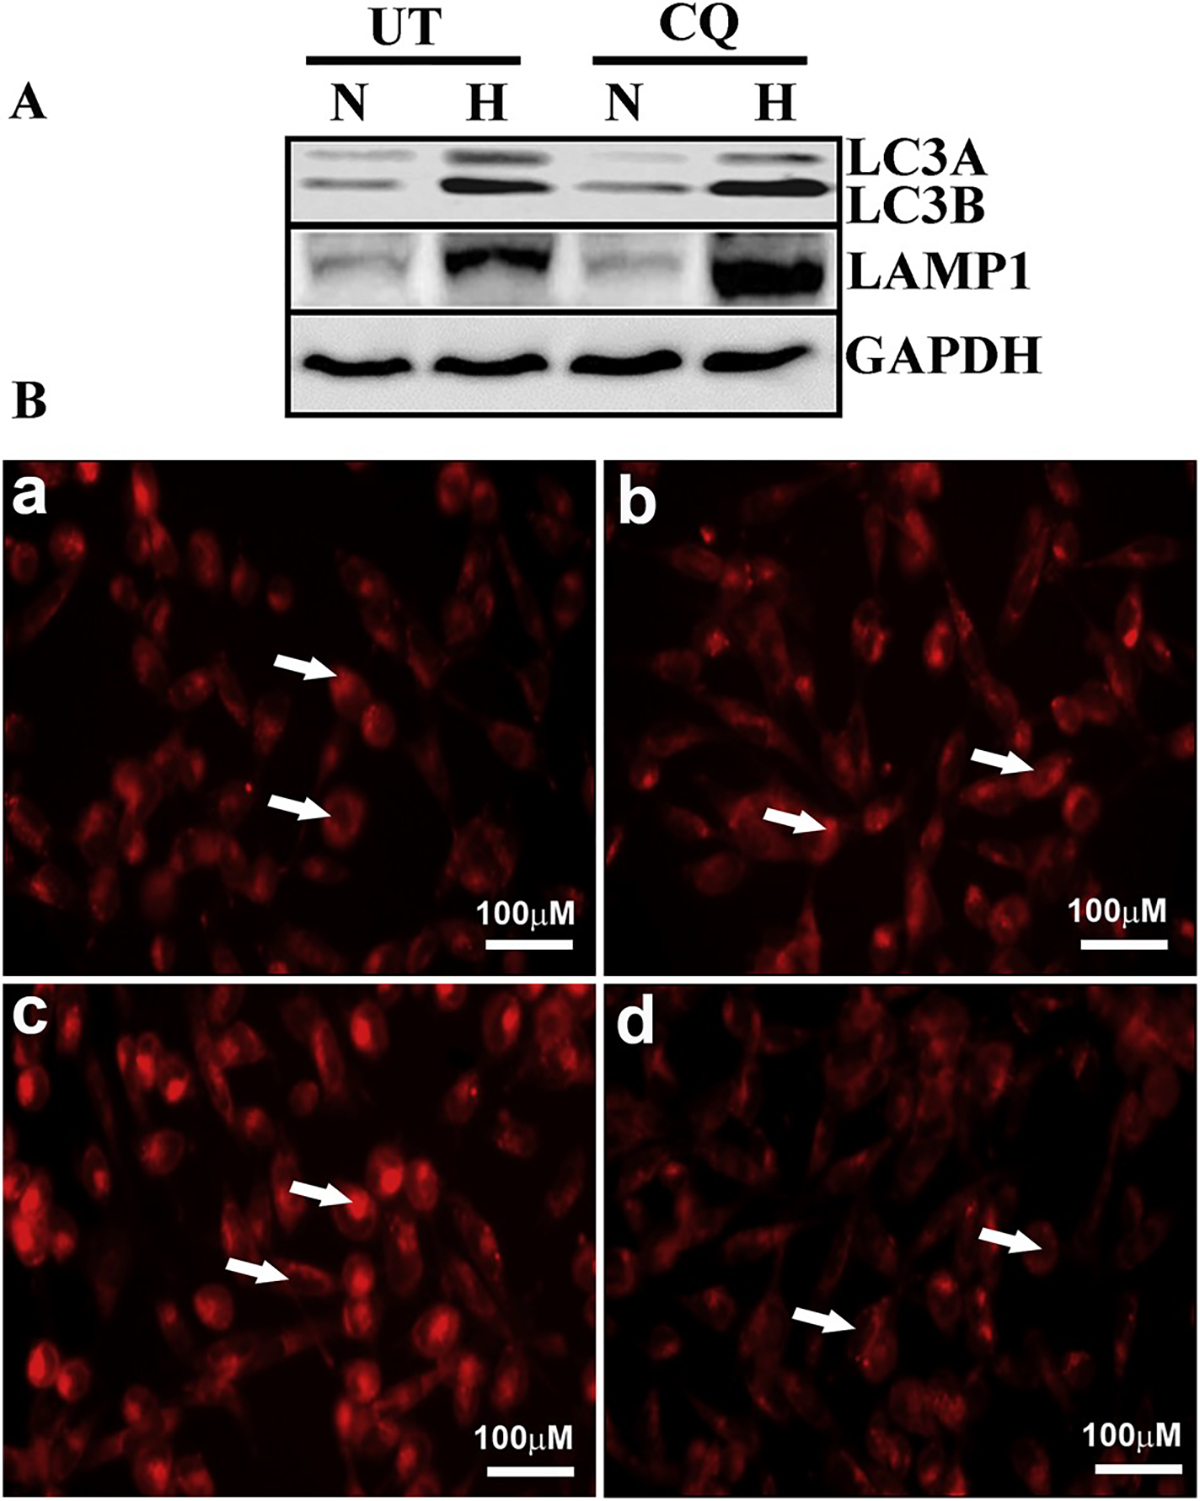
Fig. 8. Expression of autophagy-related proteins in oxidatively stressed HCE cells.

A) Western blot analysis shows expression of LC3A/B and LAMP1 in HCE cells under normoxic (N) and hyperoxic (H) conditions with chloroquine treatment (CQ) or sham treatment control (UT). GAPDH served as the loading control. B) Immunofluorescence of lysosomal content in oxidatively stressed HCE cells. Panels A–D show lysotracker staining (arrows) of normoxic cells (a), normoxic cells treated with chloroquine (b), hyperoxic cells (c) and hyperoxic cells treated with chloroquine (d).
(CQ: chloroquine; GAPDH: glyceraldehyde 3-phosphate dehydrogenase; H: hyperoxia; HCE: human corneal epithelium; LAMP1: lysosomal-associated membrane protein 1; LC3: microtubule associated protein 1 light chain 3 alpha; N: normoxia).
