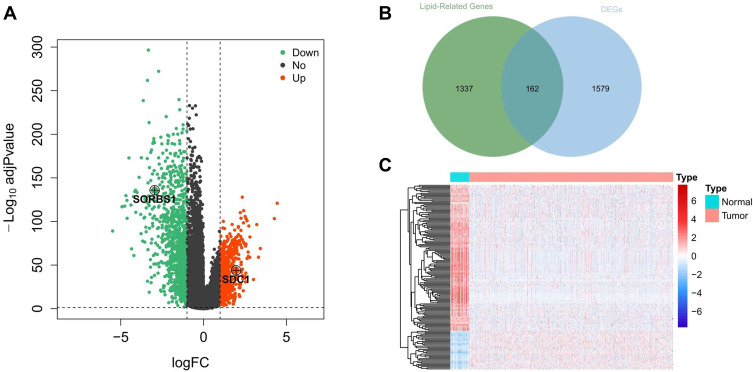
Figure 1.
Identification of metabolism-related genes and construction of a prognostic classifier. (A) A volcano plot of all DEGs is shown combined with |log2FC| and an adjusted p-value. Red represents 644 upregulated DEGs. Green represents 1088 downregulated DEGs. (B) Extraction of metabolism-related genes from the DEGs. (C) Heatmap of lipid metabolism-related DEGs between tumor and matched adjacent normal tissue. Different colors represent the expression trend of lipid metabolism-related DEGs in the two groups, red represents high expression of genes and blue represents low expression of genes.
Abbreviations: DEGs, differentially expressed genes; FC, fold change.

