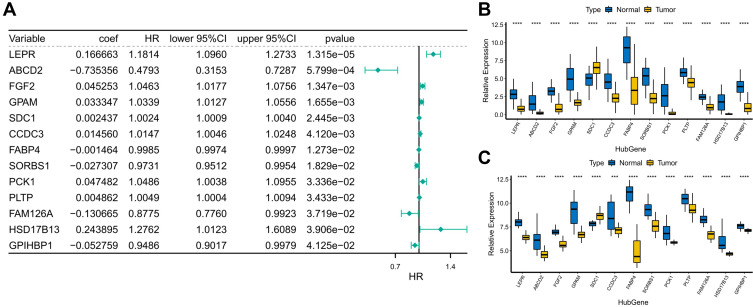
Figure 2.
Functional enrichment analysis of candidate prognosis-related lipid metabolism DEGs (A) Forest map of lipid metabolism-related DEGs associated with prognosis. (B) Expression of prognostic lipid metabolism DEGs in TCGA, where the horizontal axis represents different gene, the vertical axis represents the gene expression distribution, where different colors represent different groups. Asterisks represent levels of significance, ****p < 0.0001. (C) Expression of prognostic lipid metabolism DEGs in GSE109169, where the horizontal axis represents different gene, the vertical axis represents the gene expression distribution, where different colors represent different groups. Asterisks represent levels of significance ***p < 0.001, ****p < 0.0001.

