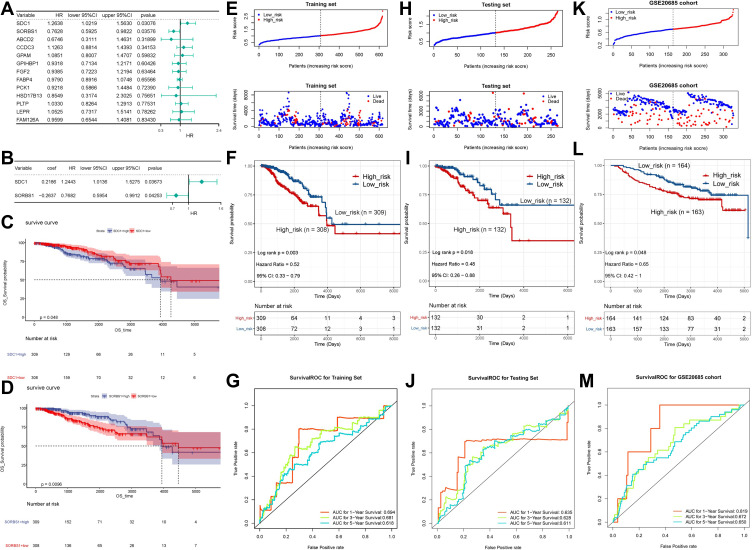
Figure 3.
Risk score independent of the prognostic analysis. (A) Univariate Cox analysis showing the hazard ratio of each candidate prognosis-related lipid metabolism DEG in predicting overall survival in BRCA from the training set. (B) Multivariate Cox regression analysis of 2 prognostic genes. (C) Survival analysis of SDC1. (D) Survival analysis of SORBS1. (E) The distribution of risk score and survival status of the training set-BRCA patients in the high- and low-risk groups. (F) Survival analysis of the high- and low-risk groups in the training set. (G) ROC curve showing the moderate accuracy of the constructed prognostic model of BRCA from the training set. (H) The distribution of ROC analysis of the two-gene signature in the testing set. (I) The distribution of Kaplan-Meier survival analysis of the two-gene signature in the testing set. (J) The distribution of risk score and survival status analysis of the two-gene signature in the testing set. (K) The distribution of ROC analysis of the two-gene signature in the GSE20685 dataset. (L) The distribution of Kaplan-Meier survival analysis of the two-gene signature in the GSE20685 dataset. (M) The distribution of risk score and survival status analysis of the two-gene signature in the GSE20685 dataset.
Abbreviations: ROC, receiver operating characteristic curve; K-M, Kaplan-Meier; SDC1, Syndecan-1; SORBS1, sorbin and SH3 domain containing 1.

