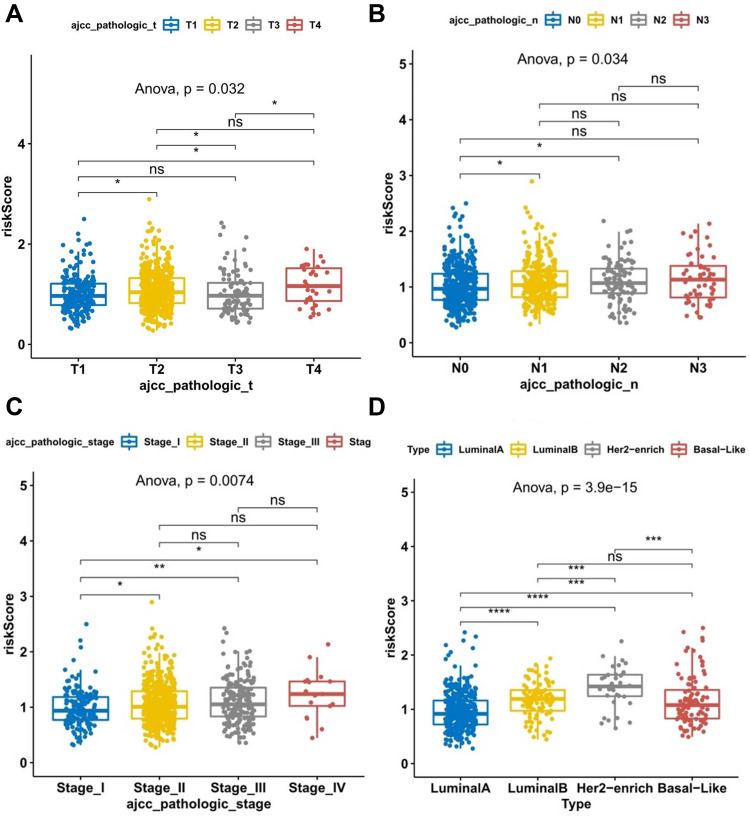
Figure 4.
Scatter dot plot shows the association between risk score of TCGA breast cancer samples and clinical characteristics. (A) Risk scores in the different pathologic T stages of BC. (B) Risk scores in the different pathologic N stages of BC. (C) Risk scores in the different pathologic stages of BC. (D) Risk scores of different BC subtypes. *P < 0.05; **P < 0.01; ***P < 0.001; ****P < 0.0001.
Abbreviations: BC, breast cancer; TCGA, The Cancer Genome Atlas.

