Figure 6.
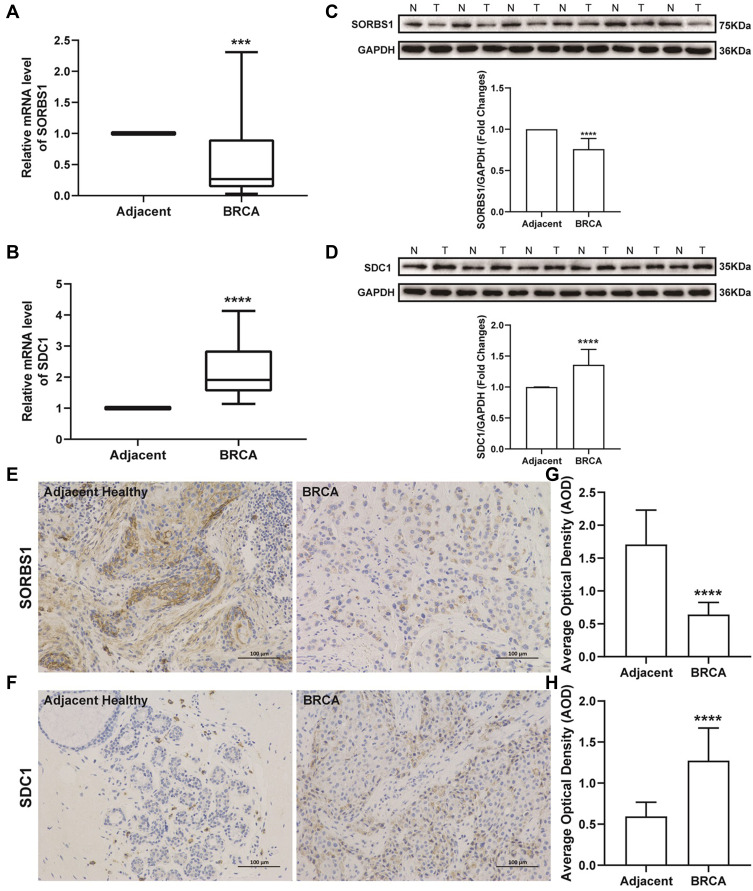
Expression levels of SORBS1 and SDC1 proteins in clinical samples. (A) Expression levels of SORBS1 measured by qRT-PCR analysis. (B) Expression levels of SDC1 measured by qRT-PCR analysis. (C) Representative image of Western blot analysis of SORBS1 protein. N, Adjacent healthy samples; T, BRCA samples. (D) Representative image of Western blot analysis of SDC1 protein. (E) Immunohistochemical staining (SORBS1 protein) of BRCA and adjacent healthy groups; magnification, ×200. (F) Immunohistochemical staining (SDC1 protein) of BRCA and adjacent healthy groups; magnification, ×200. (G and H) The AOD of SORBS1 and SDC1 protein in BRCA and adjacent healthy groups. Mean ± SEM; n = 30; ***P < 0.001 vs adjacent healthy; ****P < 0.0001 vs adjacent healthy.
Abbreviations: SORBS1, sorbin and SH3 domain containing 1; SDC1, Syndecan-1; AOD, average optical density.

