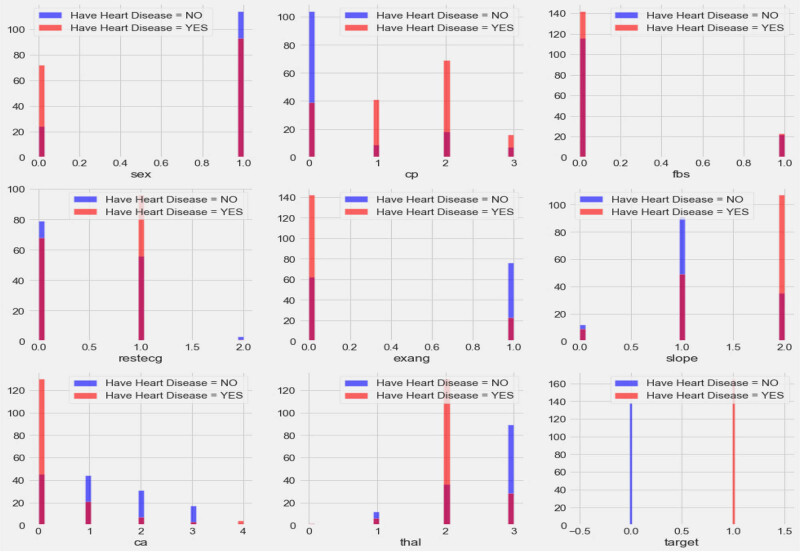
Figure 3.
Correlation plot for CVD data set categorical features (cp: chest pain, fbs: fasting blood sugar, Restecg: resting electrocardiographic result, exang: exercise-induced angina, slope: slope of peak ST segment, Ca: number of major vessels, thal: thallium stress result, and target output (1 = patient having CVD, 0 = patient not having CVD)).

