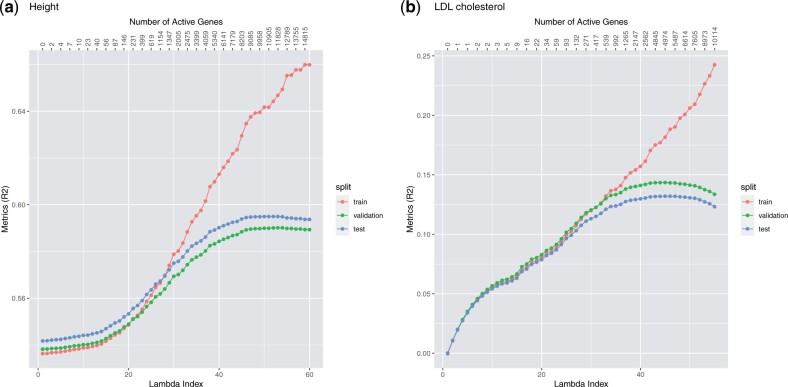
Fig. 4.
Lasso path plots for the quantitative phenotypes height and LDL cholesterol. The horizontal axis is the index of the regularization parameter λ, the vertical axis are the R-squared of the solution corresponding to each λ index. The numbers on the top are the number of genes with non-zero coefficients at the corresponding λ indices. The color corresponds to the train, validation and test set. The duration of training these two models (including data loading and mean imputation) are 8.34 and 8.35 min, respectively. Plots a and b correspond to the phenotypes height and LDL cholesterol, respectively.

