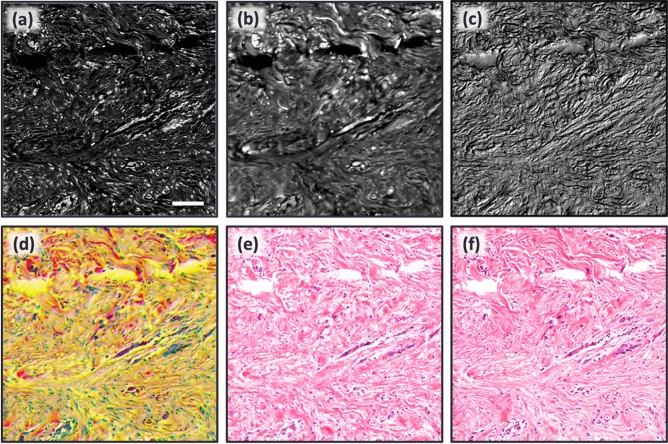
Figure 4.
The colorization network input and output images of human skin tissue slide. (a) TA-PARS non-radiative absorption contrast image captured using a TA-PARS microscope. (b) TA-PARS radiative absorption contrast of the same tissue using the same microscope. (c) TA-PARS optical scattering contrast. (d) TA-PARS image of all three channels (network input to be colorized). (e) Colorized TA-PARS image using Pix2Pix model. (f) Histologically stained tissue of the same region taken on a bright field microscope, the ground truth for the virtual staining framework. Scale bar: 100 µm.

