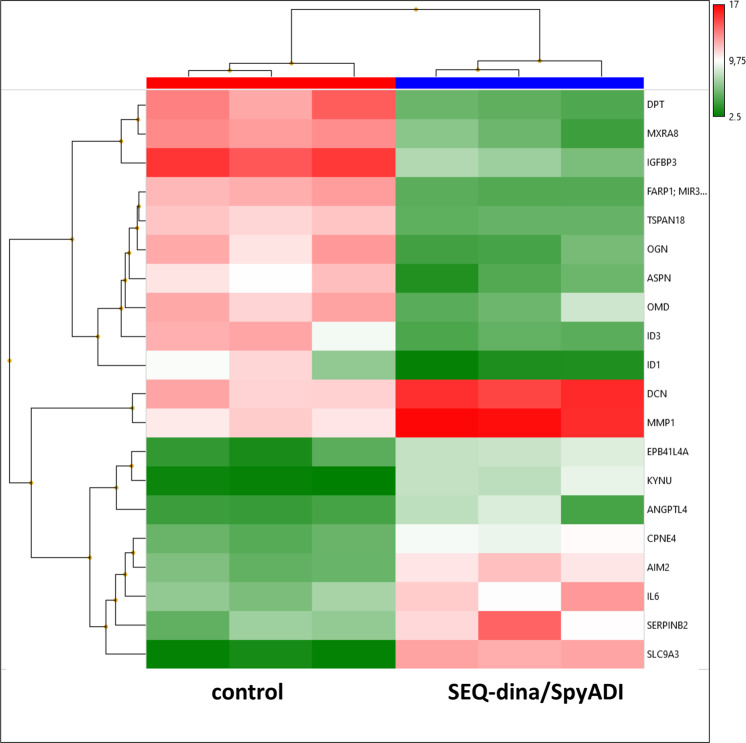
Fig. 7. Heat map showing RNA expression level from 2D-cultured HROG63 cells.
Therefore, cells were either treated with SEQ-dinaciclib/SpyADI or left untreated. RNA was isolated as described in material and methods and RNA expression level determined by applying Affymetrix Human Clariom S Array. Primary data analysis was performed with the Affymetrix TAC including the SST-RMA for normalization. Gene expression data were log-transformed. Limma was used here to calculate the p-value. A change was considered significant when the Limma eBayes p-value met the criterion p < 0.05 at fold-changes > |2 | , i.e., expression increments or declines larger than two. Data are collected from three independent experiments.

