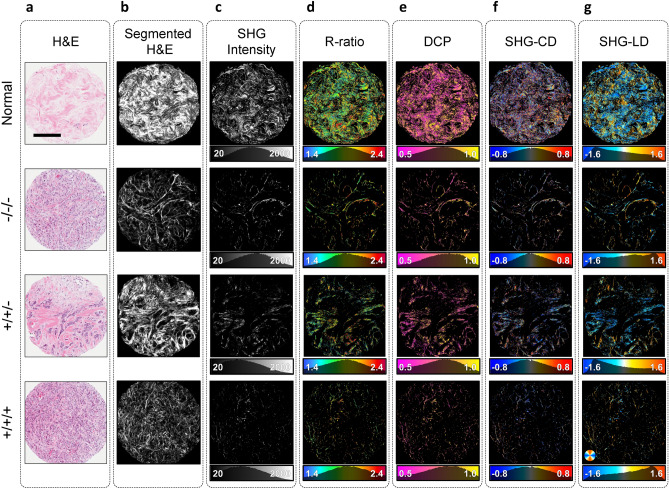
Figure 3.
Widefield P-SHG polarimetric parameters. (a) Representative H&E white light images of normal and three tumor breast cores with different expressions of the receptors ER/PR/HER2. Scale bar: . (b) Segmented images display the portion of H&E images stained by Eosin, which serves as a good estimate for total collagen content of the tissue. (c) SHG intensity of circularly-polarized incident light, highlighting ordered collagen fibers. Normal core produces much larger SHG signal. (d) R-ratio images of cores range from 1.4 to 2.4, indicating the presence of collagen in the tissue. (e) Degree of circular polarization images show larger means in tumor due to higher R-ratio and low depolarization. (f–g) SHG-CD and SHG-LD images depict the out-of-plane and in-plane fiber orientations, respectively. Due to unbiased sectioning of the tissue, collagen fibers are at random orientations, resulting in SHG-CD distributions centered around zero, and SHG-LD distributed randomly.

