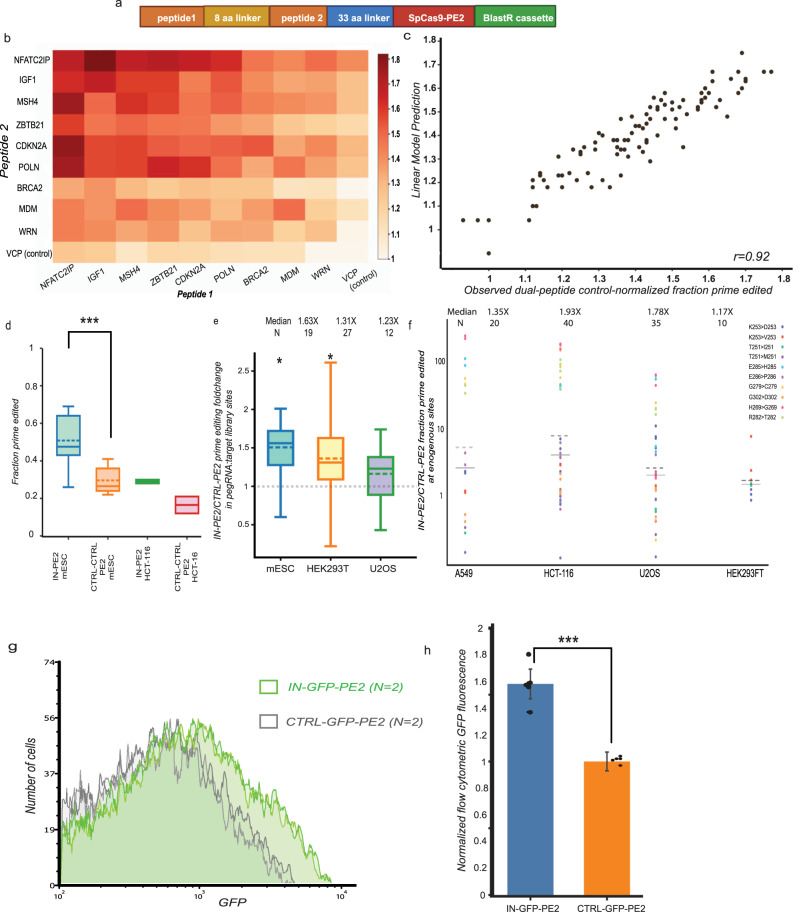
Fig. 2. A dual-peptide-PE2 displays improved prime editing efficiency across dozens of loci in four cell lines.
a Construct design for a dual-peptide PepSEq library with all possible pairs of top 10 peptides. b Comparison of control-normalized prime edited fraction for 81 dual-peptide pairs. c Comparison of control-normalized dual-peptide prime edited fraction predicted by a linear model vs. observed median prime edited fraction. d Comparison of prime edited fraction for IN-PE2 vs. control-control-PE2 in mESC (n = 8 independent replicates) and HCT-116 (n = 4 replicates) dual-peptide screen. Bars represent mean signal (solid line) and median (dotted line); e Comparison of median control-normalized prime edited fraction for IN-PE2 in the 100-target library across three cell lines. Bars represent mean signal (solid line) and median (dotted line); n = 19; 27; 12 independent replicates. f Comparison of prime edited fraction for IN-PE2 vs. CTRL-PE2 at a set of twelve endogenous sites in HEK293T, HCT116, A549 and U2OS. n = 4 independent replicates. g Flow cytometric GFP fluorescence intensity for two representative replicates of IN-GFP-PE2 vs. CTRL-GFP-PE2 in mESCs. h Comparison of IN-GFP-PE2 vs. CTRL-GFP-PE2 control-normalized flow cytometric GFP fluorescence levels. n = 5 biological replicates. Boxes in (d, e) represent the 25–75 percentile ranges with the median of horizontal line. The ends of vertical lines represent minimum or maximum values. ns not significant by the Paired Student’s two-tailed t tests were performed to calculate p values. Error bars in all figures represent SD. Source data and exact p values are provided as a Source Data file. Statistically significant differences are denoted as follows: *p < 0.05, **p < 0.01, ***p < 0.001.

