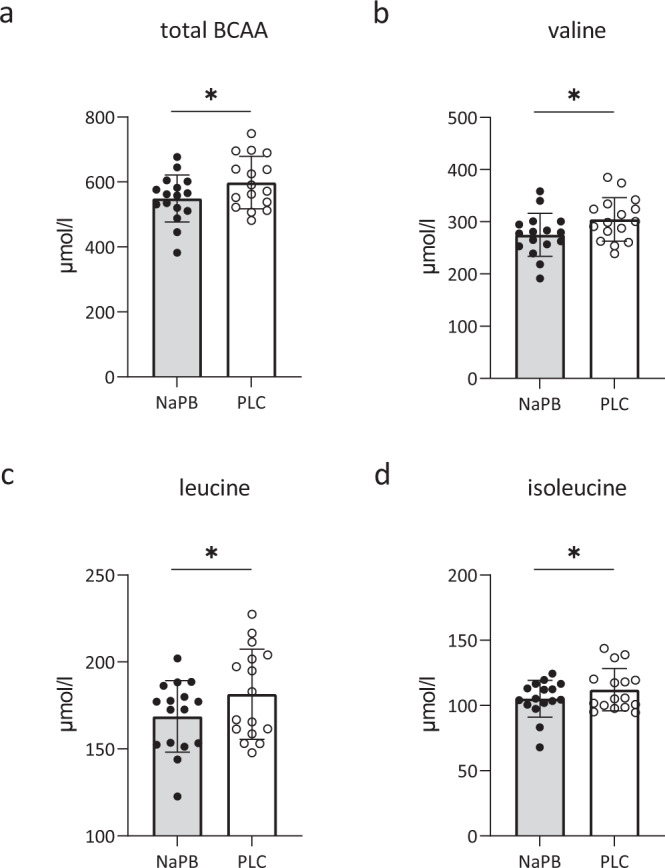
Fig. 4. NaPB treatment reduces plasma BCAA levels.

Fasting plasma BCAA’s were measured in patients with T2D after 2-week treatment with NaPB (gray bars, n = 16) and placebo (white bars, n = 16). a Total BCAA levels (µmol/l, p = 0.03), b valine levels (µmol/l, p = 0.009) and c leucine values (µmol/l, p = 0.03), and d isoleucine (µmol/l, p = 0.05). Data are expressed as mean ± SE. The intervention effect was analyzed using the paired student t-test. *P < 0.05. NaPB sodiumphenylbutyrate, PLC placebo, T2D type 2 diabetes. Source data are provided as a Source Data file.
