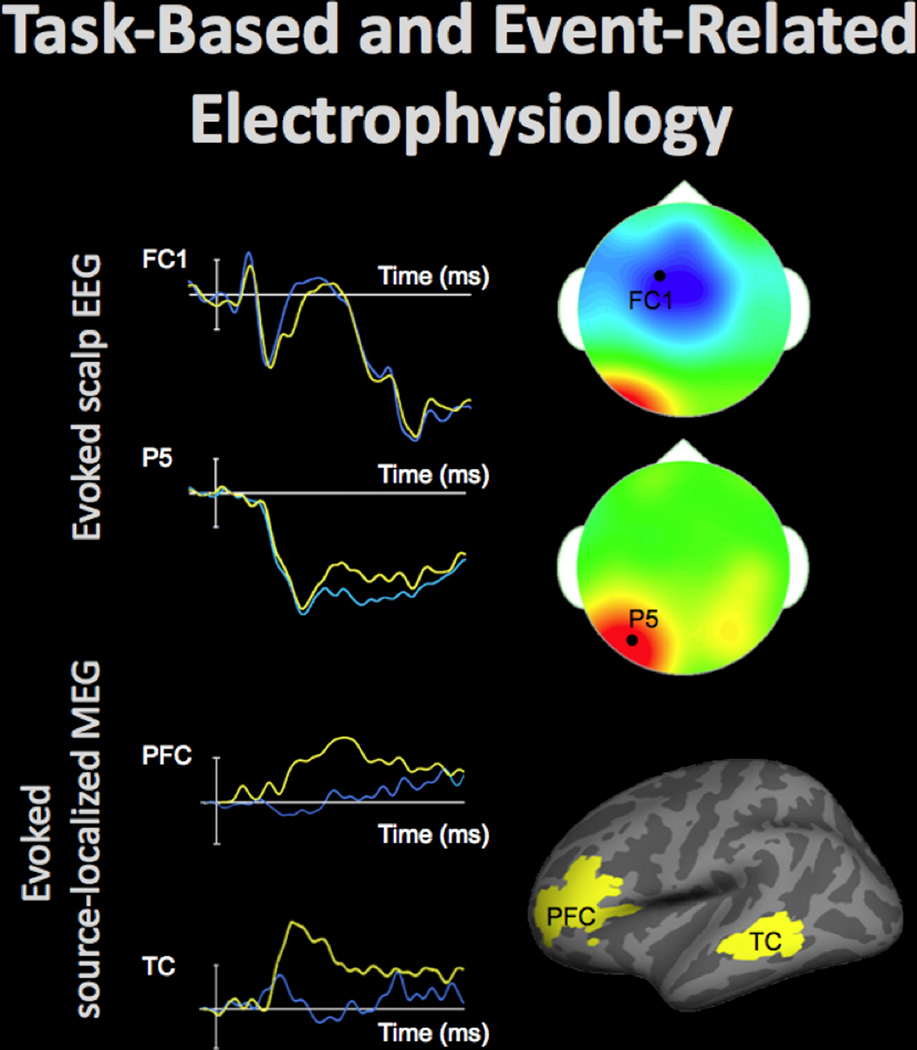
Figure 7.

Electrophysiological activity in the brain can be evaluated using electroencephalography (EEG) and magnetoencephalography (MEG). These techniques measure changes in the electric and magnetic fields, respectively, which are presumed to originate in the brain sources and rapidly propagate toward the participants’ scalp, affording high temporal resolution of the recordings. Event-related data can elucidate neural processing during performance on a task, discerning differences typically lasting between 50–500 ms. Top-left shows time-courses of the average electrophysiological response evoked by stimuli from two conditions (40 trials per condition) at FC1 and P5 EEG sensors positioned on the scalp (by convention negative voltages are plotted up). The scalp topography at the time-points (indicated by white arrows), when the between-condition differences were maximal at each of these electrodes, is shown in top-right (the data from 64 EEG sensors, locations of FC1 and P5 sensors indicated by the black dot). The fronto-central effect shown in blue (the time-course displayed in blue is more negative) and the left-posterior effect shown in red (the time-course displayed in yellow is more negative) peaked approximately 50 ms apart and were likely generated by distinct neural sources.
Models can be estimated that localize EEG and MEG data, recorded at the scalp, to the neural sources. Bottom-left shows time-courses of the average evoked electrophysiological activity (60 trials per condition) estimated at the cortical regions shown in bottom-right. The time-course in the experimental condition shown in yellow peaked a few dozens of ms earlier in the left temporal cortex (TC) than in the left prefrontal cortex (PFC).
