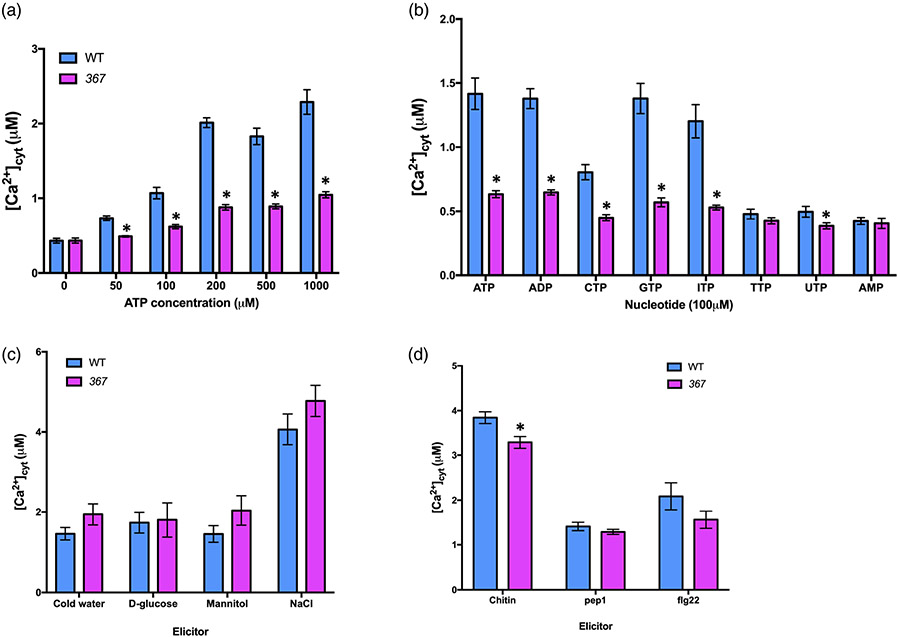
Figure 1. 367 mutant plants show defects in the calcium response to extracellular ATP (eATP) and various nucleotides.
(a) The 367 mutant is impaired in eATP-induced calcium response.
(b) The calcium response to different nucleotides was defective in the 367 mutant.
(c) Abiotic stresses-induced calcium responses in the 367 mutant are comparable to those of wild type (Col-0) (ice-cold water, 300 mm NaCl, 4% d-glucose, and 300 mm mannitol).
(d) The calcium response to chitin is slightly lower in 367 mutant plants (100 nM flg22, 100 nM Pep1, and 100 μg mT−1 chitin). The bar graph indicates the integrated calcium concentration in response to ATP addition for 300 sec. Data are presented as mean ± standard error (SE), n = 8 in (a, b), n = 6 in (c, d). Asterisks indicate a significant difference between wild-type (Col-0) and 367 mutant plants (P < 0.05, analysis of variance). Experiments were repeated at least three times with similar results.

