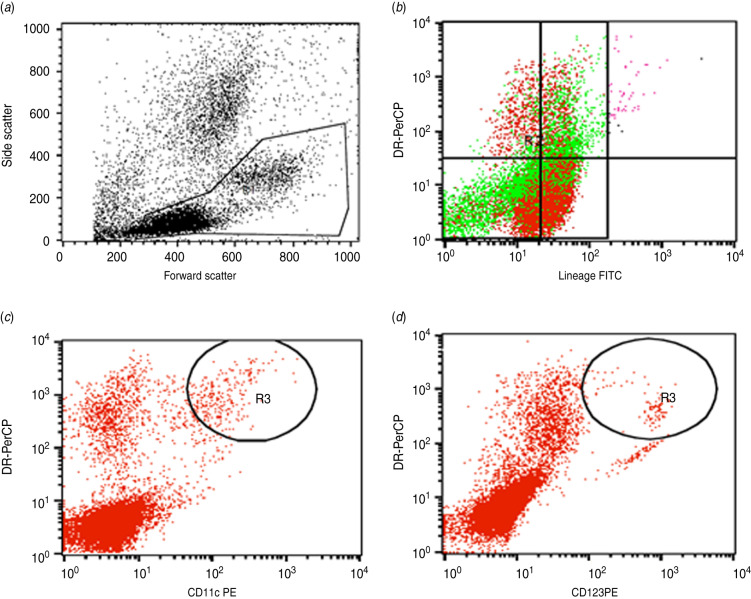
Fig. 1.
[colour online]. Representative phenotypic analysis of myeloid dendritic cell (mDC) and plasmacytoid dendritic cell (pDC) subsets by flow cytometry. (a) Peripheral blood mononuclear cells were gated according to their forward and side scatter characteristics (region R1). (b) Lin-negative but HLA-DR-positive cells were gated on region R2. (c, d) Gates R1 and R2 were selected, and mDCs were identified as Lin negative, HLA-DR-positive and CD11c-positive (c), while pDCs were identified as Lin negative, HLA-DR-positive and CD123-positive (R3) (d).

