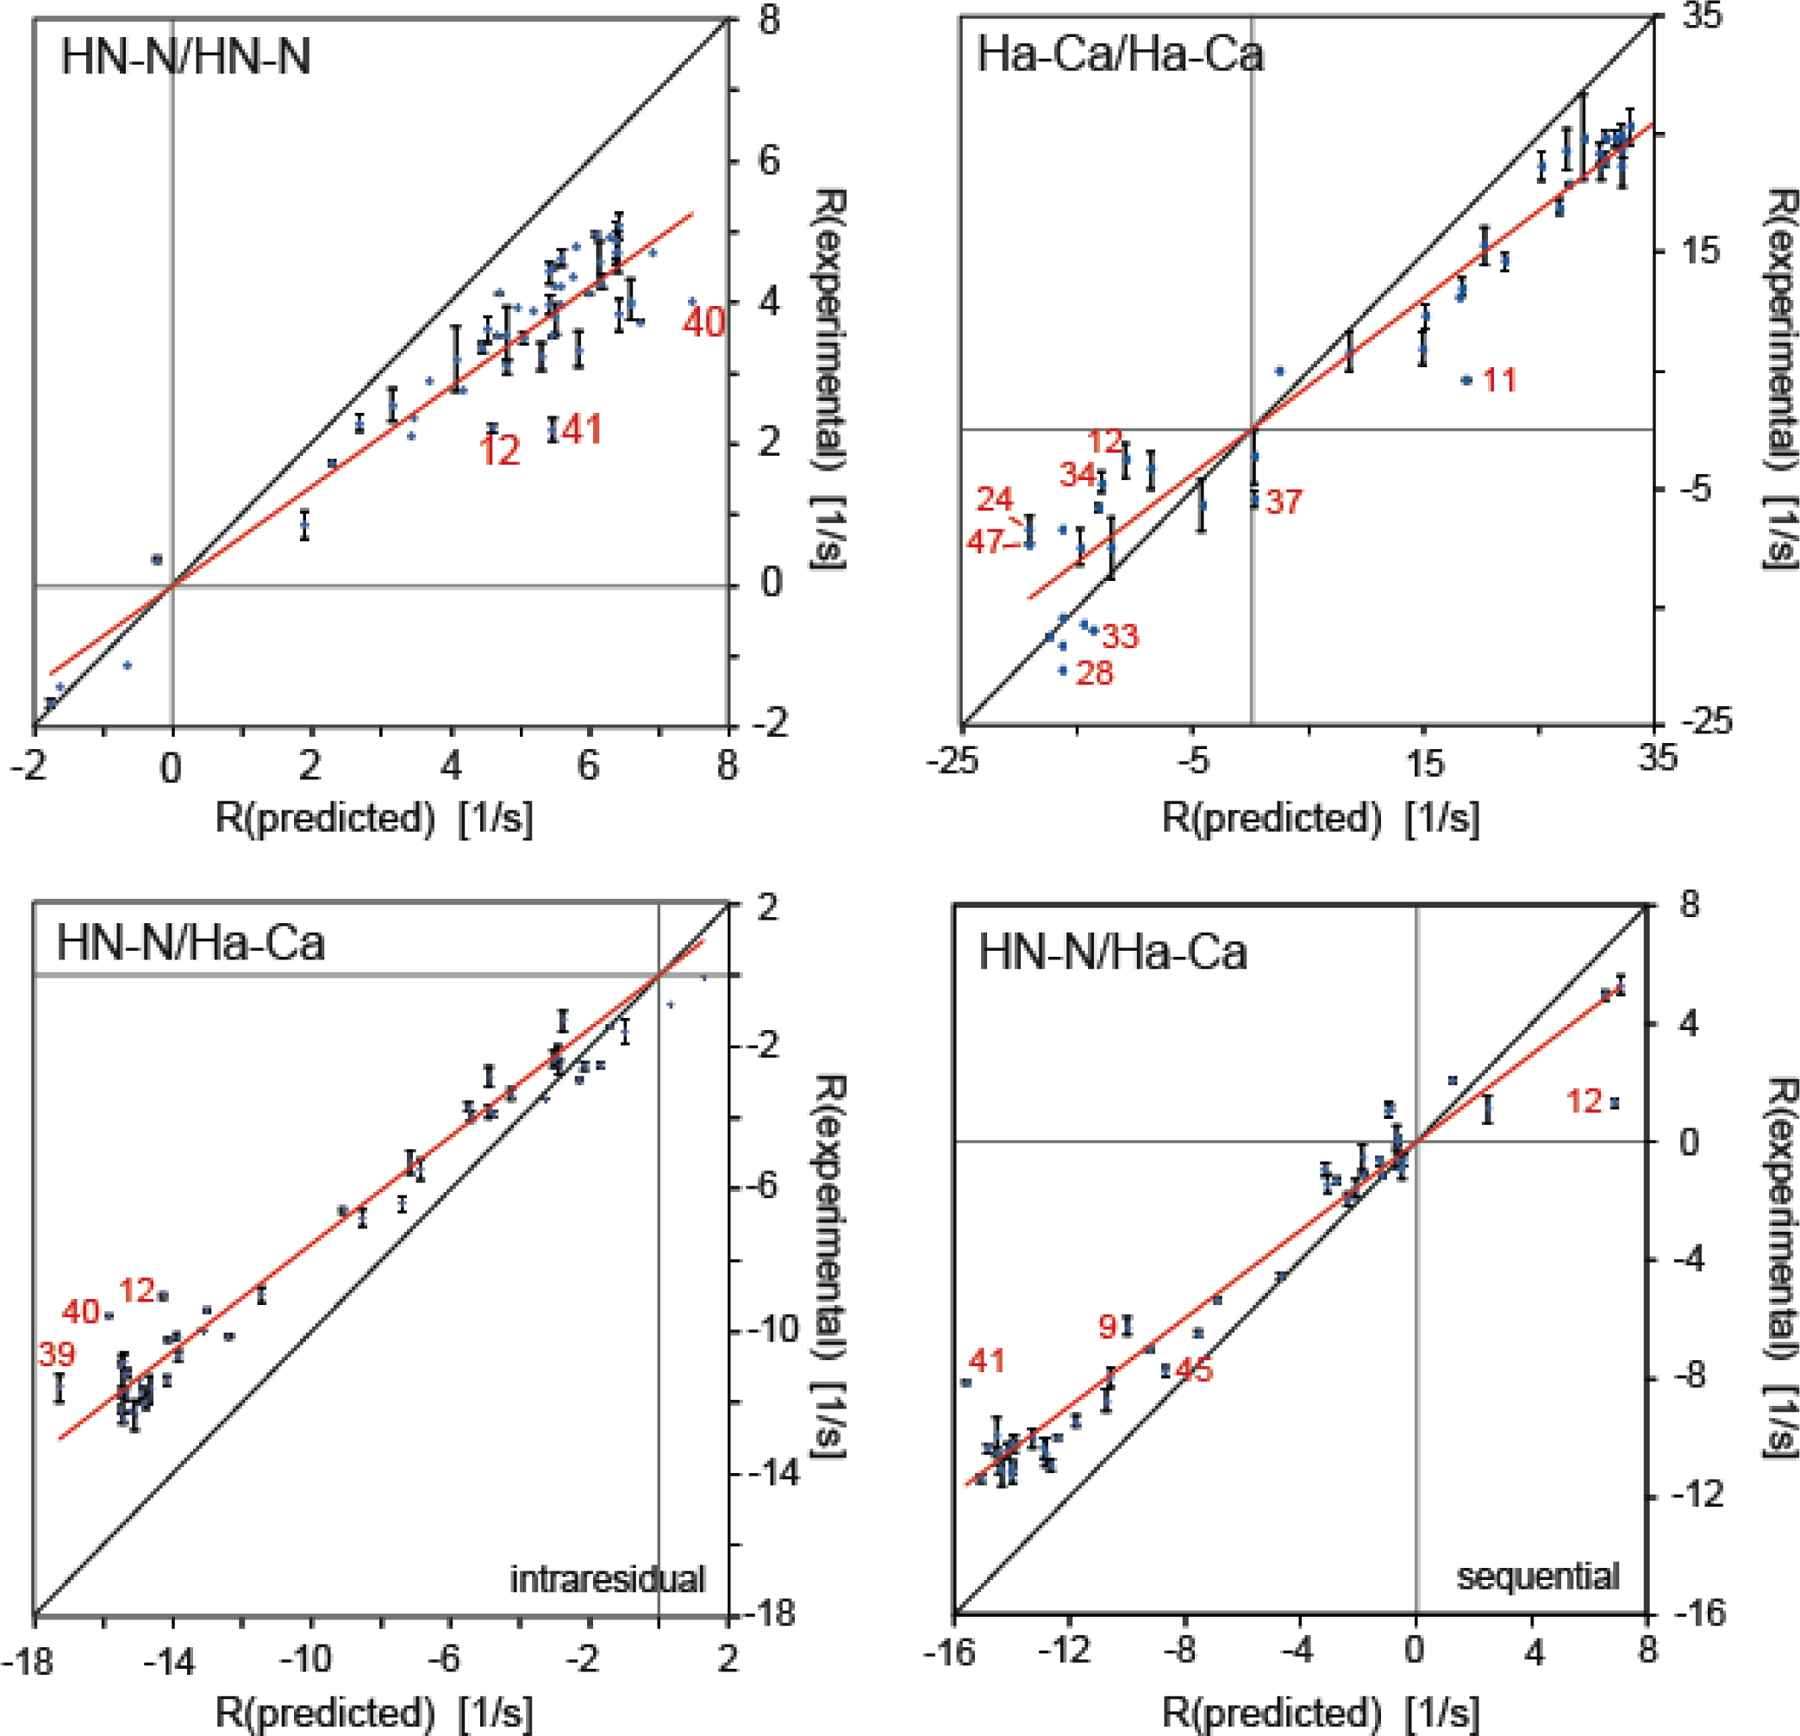
Figure 2.

Correlation plots of experimental and predicted dipolar CCR rates based on a rigid GB3 model. RDD(I1I2)/DD(S1S2) + RDD(I1S2)/DD(S1I2) is abbreviated by R. HNN/HNN and HαCα/HαCα rates are shown on the top left and right, respectively, and intraresidual and sequential HNN/HαCα rates at the bottom left and right. The theoretical rates are calculated under the assumption of anisotropic overall tumbling. The effective HN–N and Hα–Cα bond lengths are 1.02 and 1.09 Å, respectively. Linear regressions shown in red are uniform heuristic order parameters as given in equation 18. The most extreme outliers are indicated in red. The black lines indicate a slope of 1. Reprinted by permission from Springer Nature: B. Vögeli, Cross-correlated relaxation rates between protein backbone H-X dipolar interactions, J. Biomol. NMR 2017, 67, 211–232, copyright 2017.
