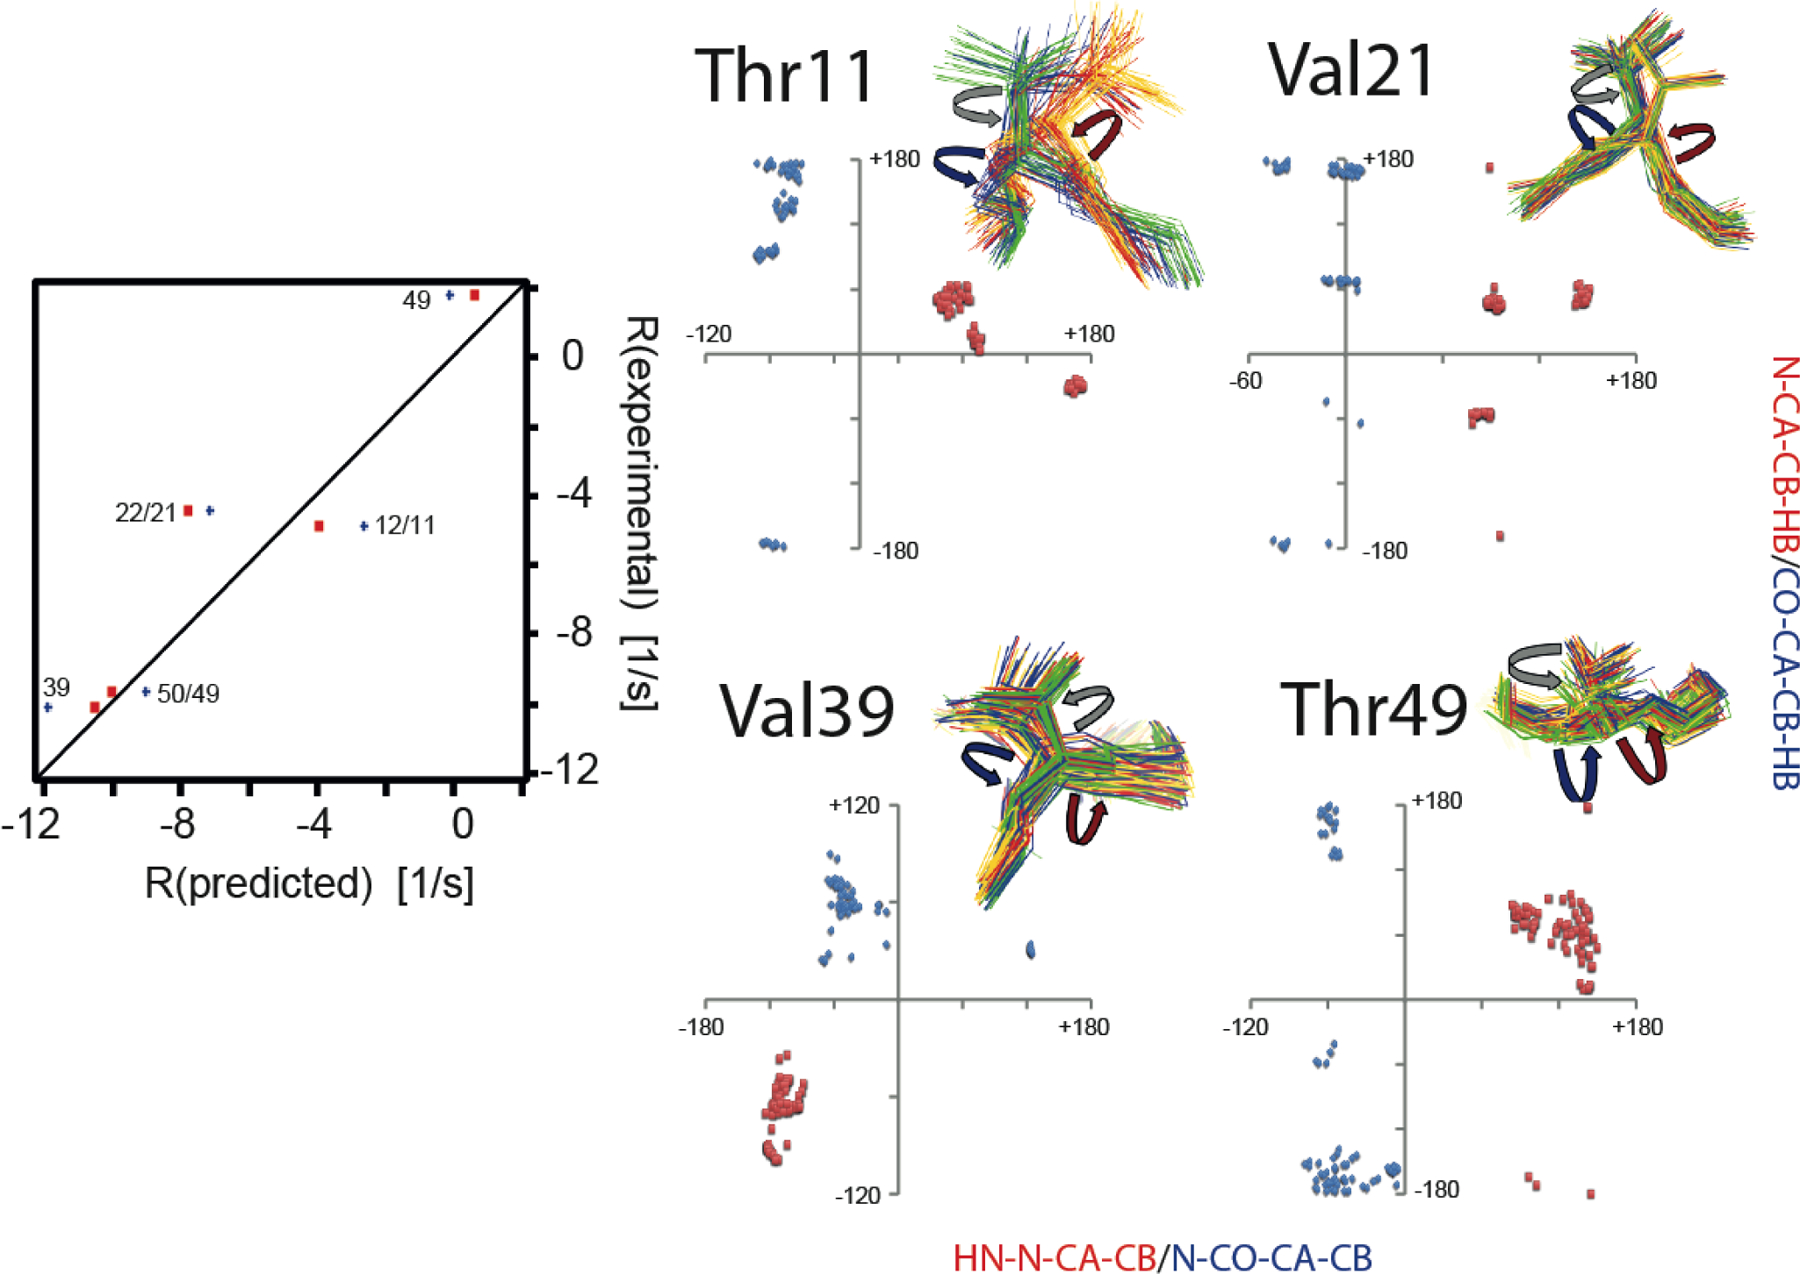
Figure 6.

Impact of correlated motion between the ϕ and χ1 or ψ and χ1 angles on CCR. Left panel, correlation plots of experimental and predicted R = RDD(HNN)/DD(CβHβ) + RDD(HNCβ)/DD(NHβ) rates based on ensembles derived from eNOEs, RDCs, and J couplings from GB3.[106,107] Only rates with changes larger than the experimental error (> 0.59 s−1) are shown. Predicted rates assuming correlated motion are shown in red squares, and those assuming uncorrelated fluctuation in blue diamonds and labeled with the residue number of the involved side-chain and amide bond. Right panel, correlation plots of HNi-Ni-Cαi-Cβi (≈ϕ+60°) and Ni-Cαi-Cβi-Hβi (≈χ1+120° for Ile, and ≈χ1–120° for Val, Thr) dihedral angles (red squares) and Ni+1-C’i-Cαi-Cβi (≈ψ−240°) and C’i-Cαi-Cβi-Hβi (≈χ1 for Ile, and ≈χ1–240° for Val, Thr) dihedral angles (blue diamonds). The angles are indicated on the four-state ensembles with red (ϕ), blue (ψ) and grey arrows (χ1). Ensemble states were grouped around residue 9. Reprinted by permission from John Wiley and Sons: R.B. Fenwick, B. Vögeli, Detection of correlated protein backbone and side-chain angle fluctuations, ChemBioChem, 2017, 18, 2016–2021, copyright 2017.
