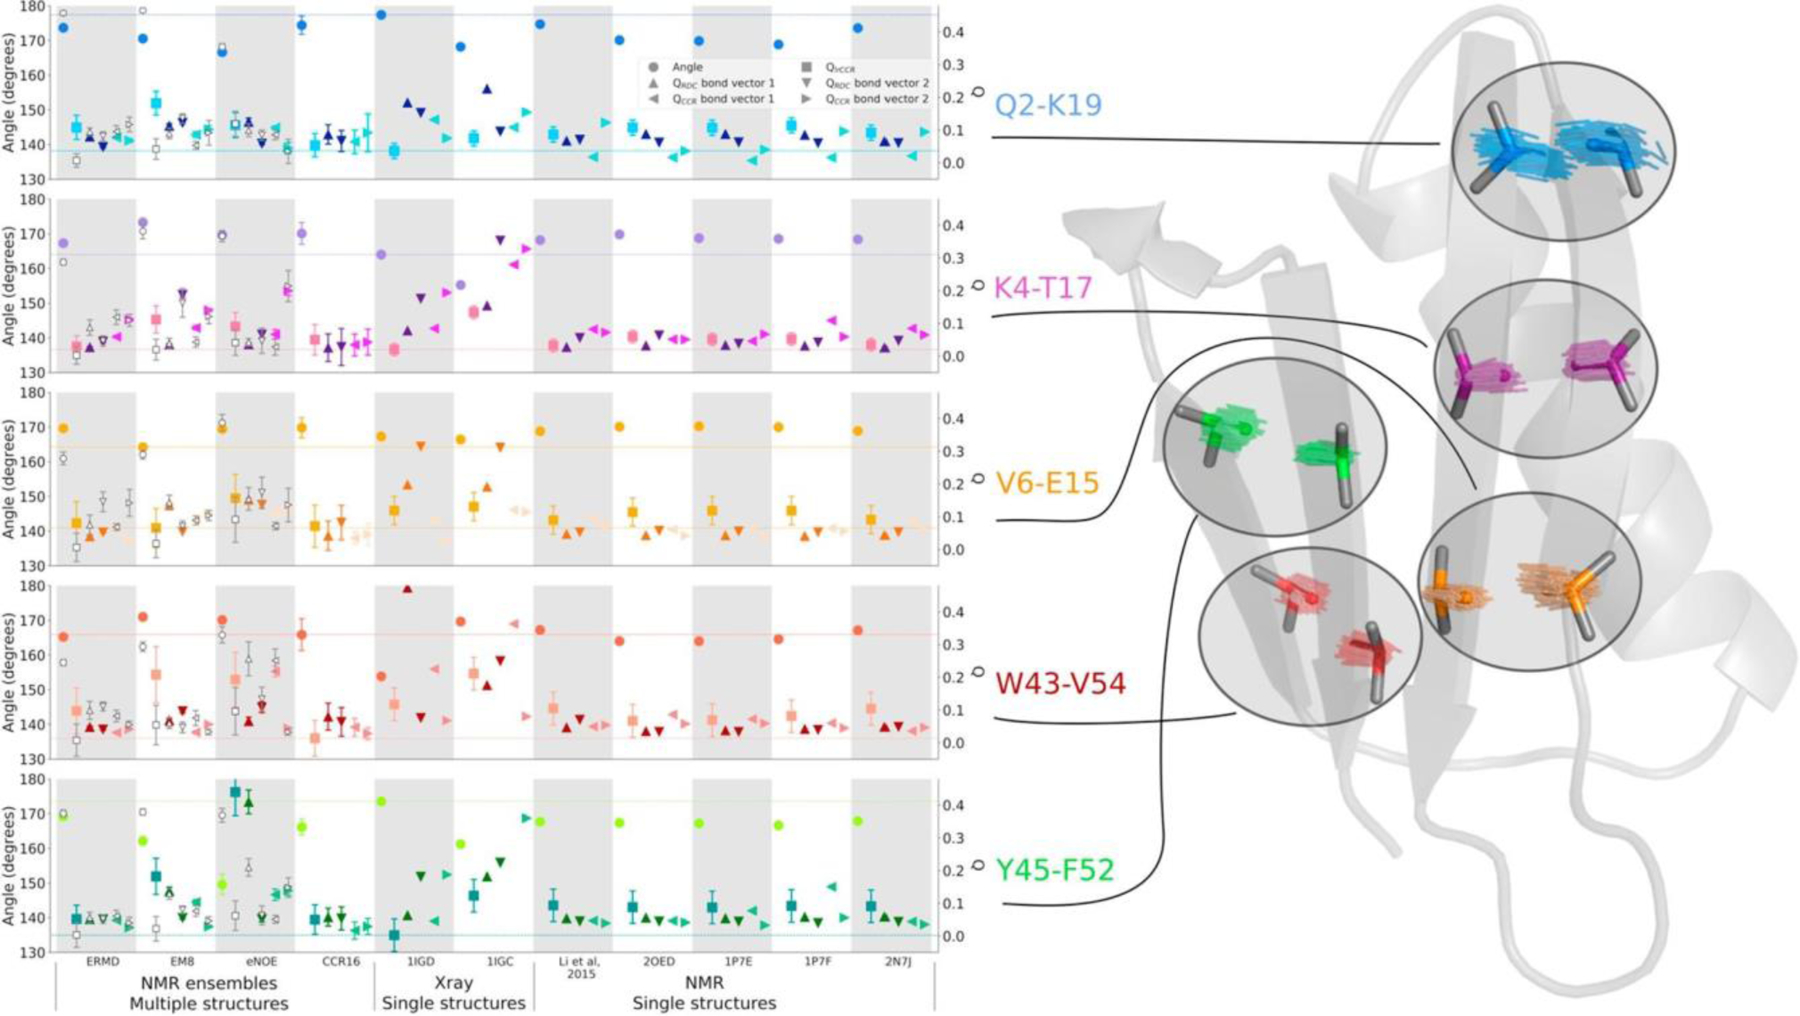
Figure 7.

Long-range HαCα/HαCα dipolar CCR rates compared to Hα-Cα bond vector representations in NMR ensembles, single NMR and X-ray structures and sub-selected ensembles of GB3. The angles between the Hα-Cα bond vectors are depicted by circle symbols (left y-axis), while the quality with which every Hα-Cα bond pair reproduces the measured observables is expressed in terms of Q values (right y-axis). The following Q values were calculated: One Q value for the lrCCR rates for every Hα-Cα bond vector pair (square), two Q values – one for each Hα-Cα bond vector – for the RDCs measured in 17 alignment media (up/down triangle), two Q values for the backbone intra-residue HNN/HαCα, sequential HNN/HαCα and HαCα/HαCα CCR rates (left/right triangle). The lines in the figure mark the level of the lowest Q value for the lrCCR rate and the inter-vector angle corresponding to that structure or ensemble with the lowest lrCCR Q value. White symbols denote the calculations for the sub-selected ensembles based on the lrCCR rates. Reprinted from M. Sabo, V. Gapsys, K.F.A. Walter, R.B. Fenwick, S. Becker, X. Salvatella, B.L. de Groot, D. Lee, C. Griesinger, Utilizing dipole-dipole cross-correlated relaxation for the measurement of angles between pairs of opposing CαHα-CαHα bonds in anti-parallel β-sheets, Methods, 2018, 138–139, 85–92, with permission from Elsevier.
