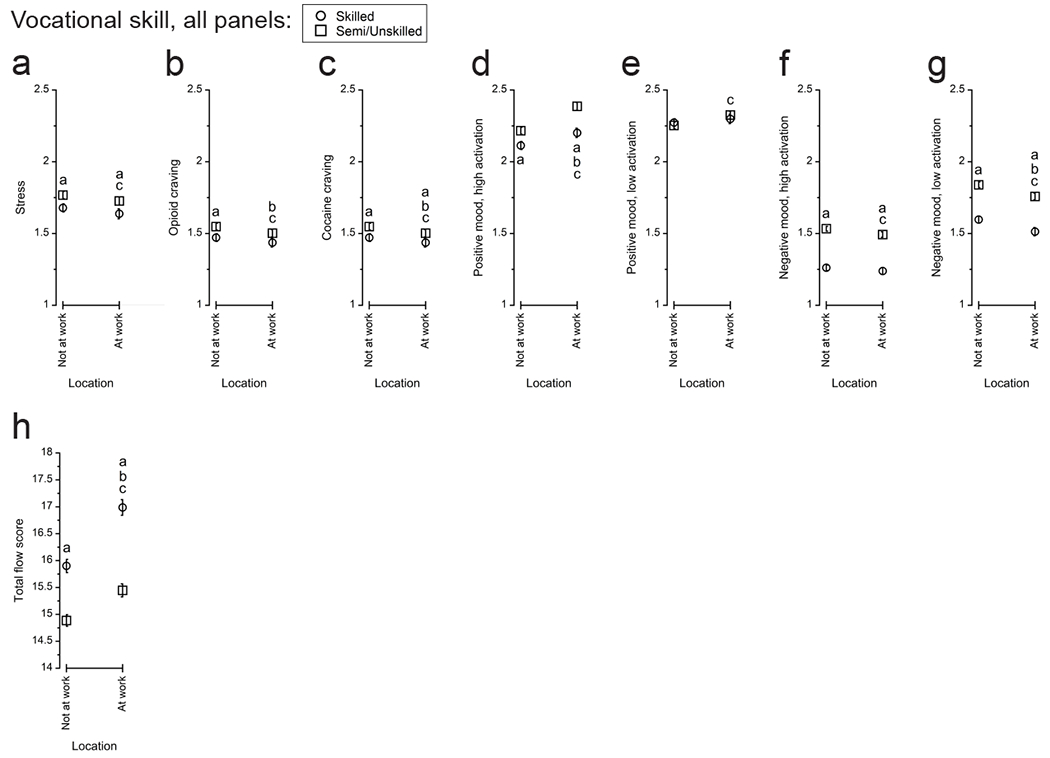
Figure 1:

Affective differences when participants reported being “not at work” vs. “at work” by their EMA random prompting. a) stress, b) opioid craving, c) cocaine craving, d) high-activation positive mood, e) low-activation positive mood, f) high-activation negative mood, g) low-activation negative mood, h) flow-like states (total flow score). Within each panel, letters indicate statistically significant (p < .05) differences: a, difference by vocational skill within location; b, difference between locations for skilled workers; c, difference between locations for semi/unskilled workers.
