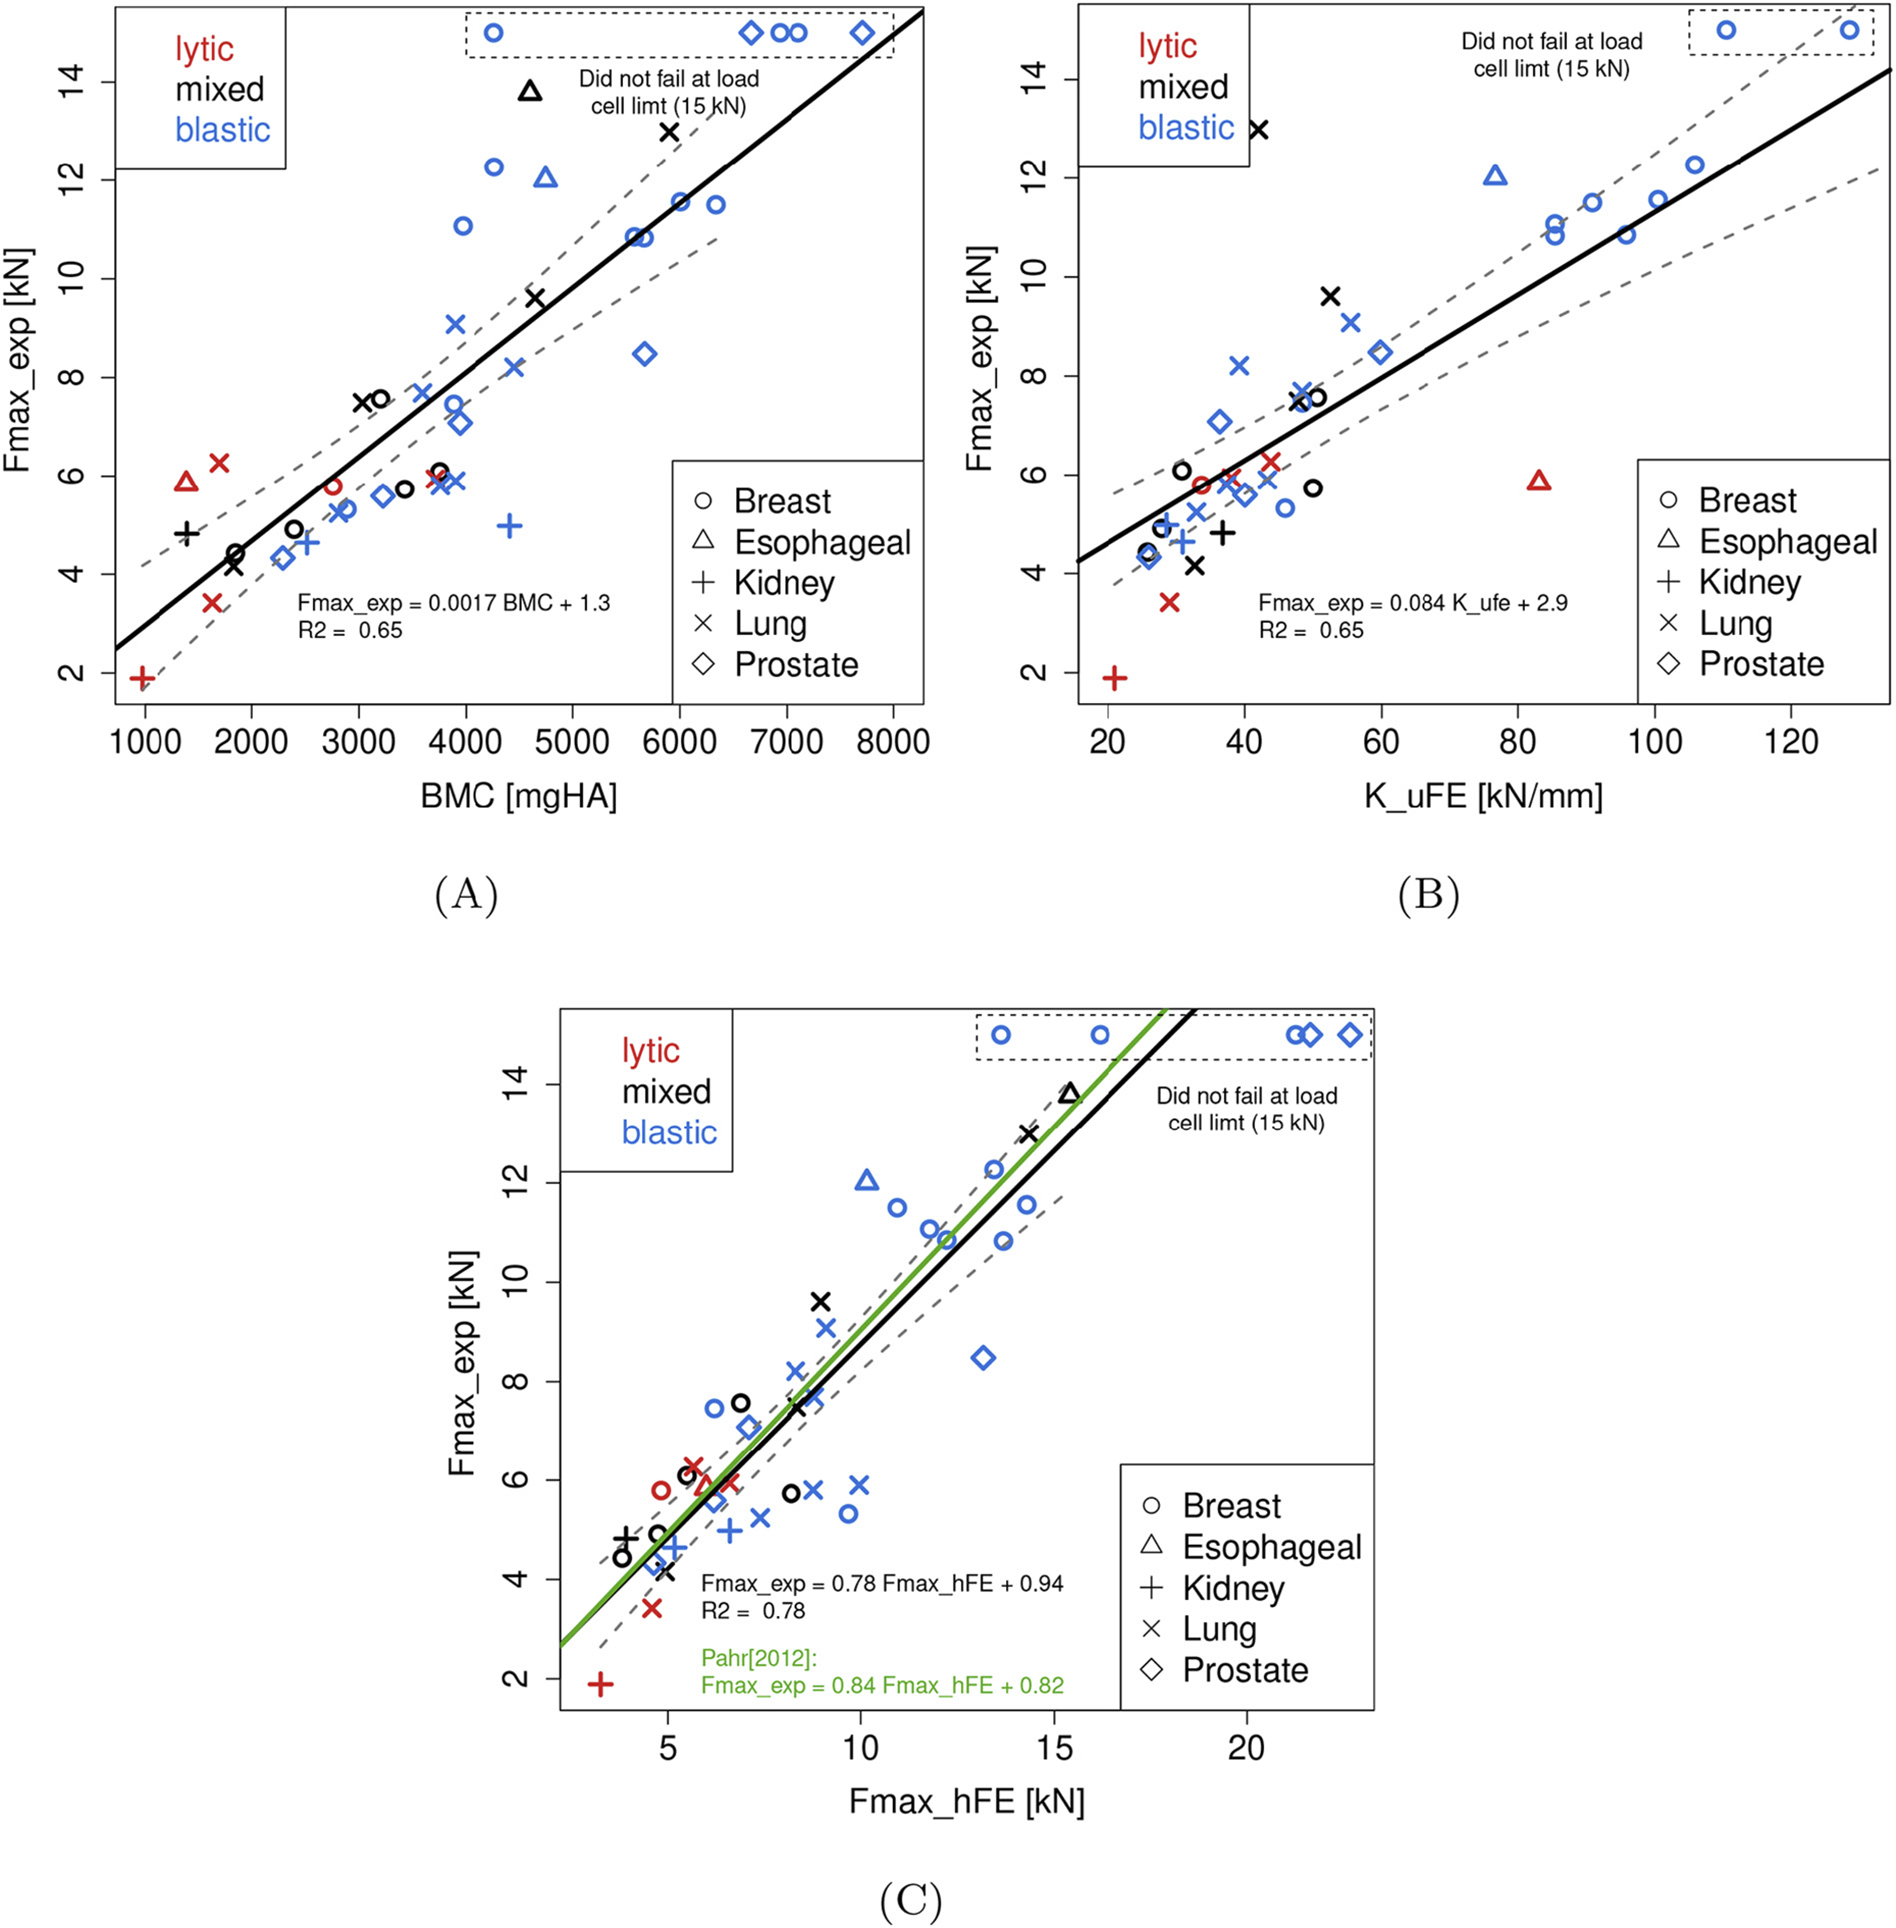
Fig. 6.

Linear relationships established between the in vitro strength (Fexp) and (A) bone mineral content (BMC), (B) μFE stiffness (KμFE), and (C) hFE strength (FhFE). The black line represents the linear regression through all data points specified by the equation given within the individual plots. The gray band around the regression lines represent the 95% confidence interval. Additionally in (B), the green line represents the linear regression reported by [66] for cancer-free vertebrae. (For interpretation of the references to colour in this figure legend, the reader is referred to the web version of this article.)
