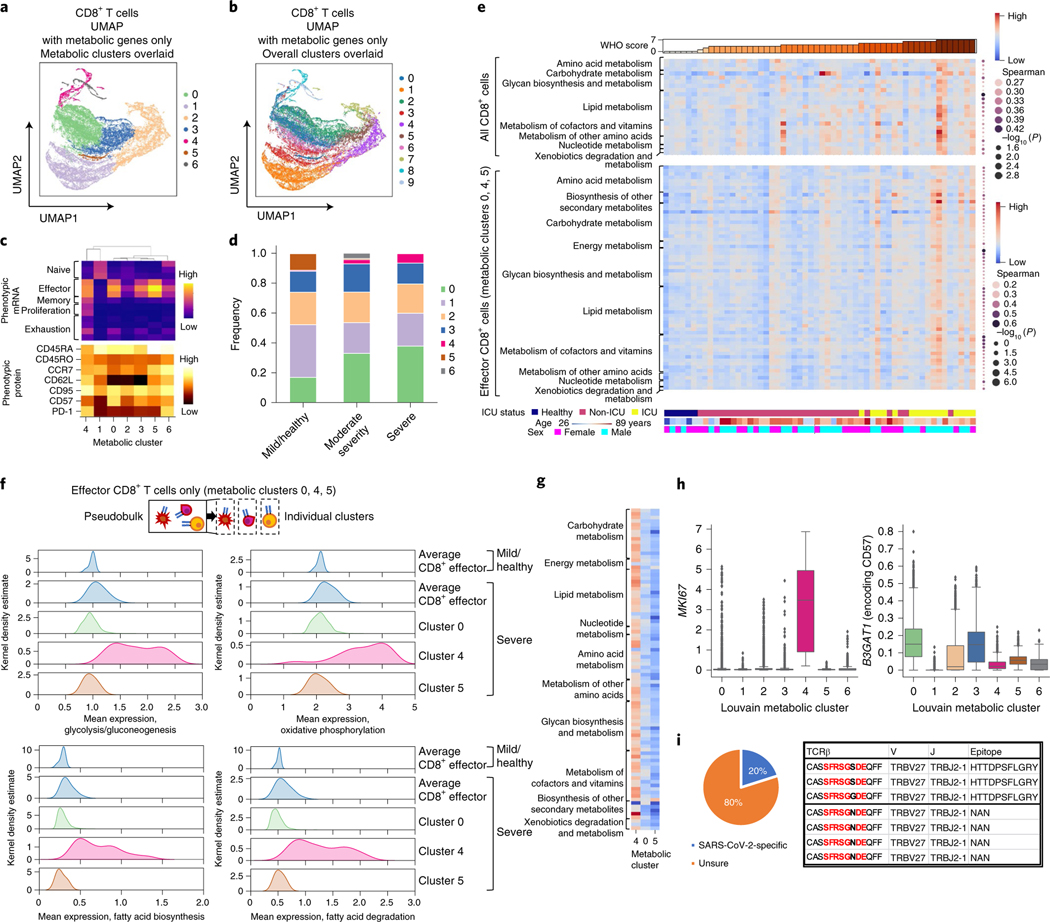
Fig. 3 |. Heterogeneous metabolic activity of CD8+ T cells is dominated by small, highly active subpopulations.
a,b, Unsupervised clustering and UMAP of CD8+ T cells using the expression of only genes involved in known metabolic pathways. Clusters defined from the expressions of only metabolic genes (a) and from the expressions of all genes (b) are overlaid. c, Heat map of mean expression of key phenotypic genes and proteins for each metabolic cluster in pseudobulk. d, Frequency of metabolically defined CD8+ T cell clusters per individual grouped by WHO score-based categories of disease severity; mild/healthy (WHO 0–2), moderate disease (WHO 3–4) and severe disease (WHO 5–7). Statistical significances of population increases or decreases were calculated by two-sided Spearman’s rank correlation. e, Metabolic pathway activities that are significantly correlated with WHO score by two-sided Spearman’s rank correlation (P < 0.05; right) for all CD8+ T cells per individual and for only effector CD8+ T cells (metabolic clusters 0, 4 and 5), each in pseudobulk. Exact P values are in Supplementary Table 7. f, Kernel density estimates of expressions of genes included in key energy-producing metabolic pathways for effector CD8+ T cells (metabolic clusters 0, 4 and 5) among individuals with mild disease and/or healthy individuals (WHO 0–2) and individuals with severe disease (WHO 5–7) in pseudobulk and separately for each of the metabolic clusters 0, 4 and 5. g, Comparison of metabolic pathway activities between CD8+ T cell metabolic clusters 0, 4 and 5 for all samples combined. h, Expression of T cell proliferation marker MKI67 and replicative senescence marker B3GAT1 (encoding CD57) in each metabolically defined cluster of CD8+ T cells (metabolic cluster 0, n = 8,525 cells; 1, n = 5,983; 2, n = 5,270; 3, n = 4,230; 4, n = 1,008; 5, n = 475; 6, n = 475). Boxes indicate 25th, 50th and 75th percentiles. Whiskers indicate 1.5 interquartile ranges below and above the 25th and 75th percentiles, respectively. i, Grouping of lymphocyte interactions by paratope hotspots (GLIPH) analysis of cluster 4 TCRs with published antigen-specific TCRs; left, pie chart illustrating fractions of TCRs from cluster 4 cells that are within the same GLIPH group with published SARS-CoV-2-specific TCRs; right, one representative GLIPH group that contains SARS-CoV-2-specific TCRs and cluster 4 cell TCRs.

