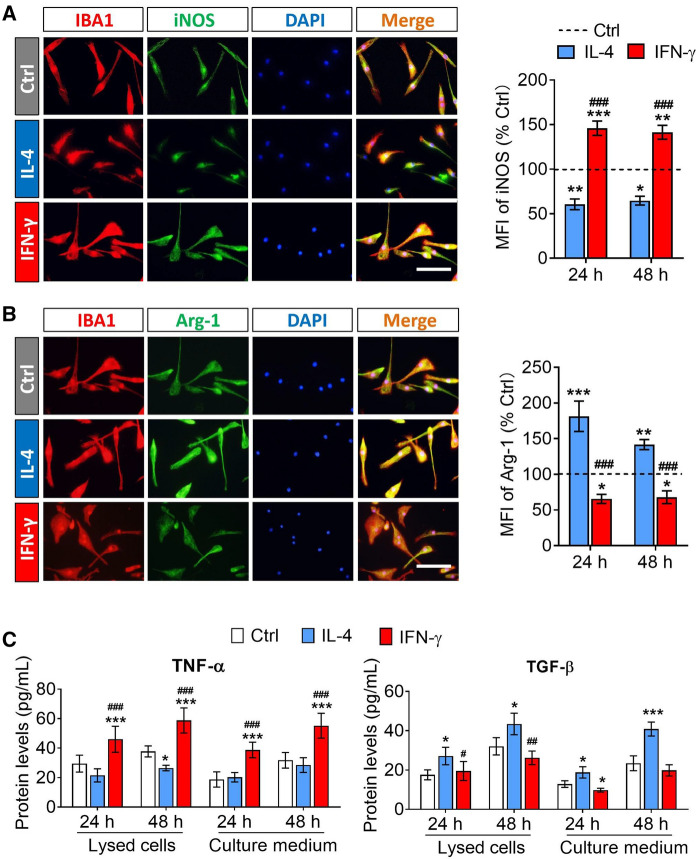
Fig. 2.
The expression of pro-inflammatory markers and anti-inflammatory markers in microglia after treatment with IFN-γ or IL-4 for 24 h and 48 h. A and B Fluorescence micrographs of the expression of iNOS and Arg-1 when microglia were exposed in PBS, IFN-γ or IL-4 for 24 h. iNOS and Arg-1 was stained with antibody (green). The microglia were stained IBA1 (red) and the nucleus is labeled by DAPI (blue). Scale bar is 10 μm. The histograms represent quantification of the mean fluorescence intensity (MFI) of iNOS or Arg-1 when microglia were exposed in PBS, IFN-γ or IL-4 for 24 h and 48 h. C The histograms show the intracellular and extracellular protein concentrations of TNF-α and TGF-β in microglia were exposed in PBS, IFN-γ or IL-4 for 24 h and 48 h. Data are showed Mean ± SEM, n = 4–6, *P < 0.05, **P < 0.01, ***P < 0.001 vs Ctrl group, #P < 0.05, ##P < 0.01, ###P < 0.001 vs IL-4 group

